GIS
GIS概念、WEB开发框架、工具等
TODO
学习记录
EarthSDK
简介
EarthSDK是一套基于JS语言的开源免费地球可视化二次开发框架
https://wzonfjgpzd.feishu.cn/docx/NUssdX48WobIqlxU9dFcaRDhnwc
官网示例:示例首页
ARCGIS
密码重置
关闭arcgis展示权限:
登录arcgis
http://localhost:6080/arcgis/admin
进入system-handlers-rest-servicesdirectory
进入edit,去除Services Directory Enabled选中状态,点击save保存
修改arcgis密码:
重置ArcGIS Server Manager的密码
忘记了ArcGIS Server Manager的密码,可以采用以下方法进行重置
1、找到ArcGIS Server的安装目录 E: Program Files ArcGIS Server tools passwordreset。
使用命令行进入该目录。
使用命令查看用户列表: PasswordReset -l。
使用命令重置密码: PasswordReset -p 新密码。看到修改成功的提示,即表示修改成功。启服务,重新打开浏览器登录ArcGIS Server Manager验证
PasswordReset -l //查看用户列表
PasswordReset -p Arcgis@2023!175 //PasswordReset -p 新密码
坐标系转化
arcToolBox-数据管理工具-投影和变换-投影
常用坐标系 2000经纬度(GCS_China_Geodetic_Coordinate_System_2000)
数据修复,删除空几何要素
ArcToolbox-数据管理工具-要素-修复几何(修复图形为空的情况)
MAPBOX
cgcs2000 Mapbox VUE使用
安装:npm i @cgcs2000/mapbox-gl
MAPBOX源码编译、切片流程
准备:熟悉linux 安装、网络、文件等基本操作,JS、HTML等熟悉,Mapbox熟悉,SQL熟悉,,,
注意参数:同一套坐标、经纬度等
Ubuntu环境准备===》其他格式数据===》shp数据===》Windows导入postgresql数据库===》通过ogr2ogr转换为geojson===》通过tippecanoe切片(参数自控)》~~数据打包(传输更快)~~windows共享文件夹=》准备mapbox2000 js css文件====》mapbox前端代码导入数据并显示====》准备图标数据===》filter分类图标显示=====》分层数据显示====》细节优化(颜色,光,字体大小,图片大小)》加入点击显示位置》其他点击功能====》wfts底图切换==》控件加载===》wfs,wms数据加载(不同数据源)==》其他模型加入
详细步骤
环境准备
Ubuntu虚拟机:
网络环境,数据共享,Postgresql,Tippecanoe,PROJ.4、GEOS和GDAL(ogr2ogr),gcc、g++、make
windows:
Postgresql,VMware,Ubuntu镜像(官方指定),Navicat(方便查看数据和建立空间数据库),VSCode
详细步骤:
安装Postgresql数据库,环境配置,导入shp
Windows安装Postgresql
环境变量添加
设置外网访问(pg_hba.conf)
# TYPE  DATABASE        USER            ADDRESS                 METHOD

# IPv4 local connections:
host    all             all             127.0.0.1/32            md5
host    all             all             0.0.0.0/0            md5
# IPv6 local connections:
host    all             all             ::1/128                 md5
# Allow replication connections from localhost, by a user with the
# replication privilege.
#host    replication     postgres        127.0.0.1/32            md5
#host    replication     postgres        ::1/128                 md5
建立空间数据库,目标数据库执行以下语句
create extension postgis;
create extension postgis_topology;
create extension fuzzystrmatch;
create extension postgis_tiger_geocoder;
在SHP文件夹新建txt文件,粘贴以下代码,导入数据到数据库,相关参数如下,改成bat后缀,双击运行后输入密码,显示类似 insert 1成功
shp2pgsql -s 4544 -c -W “GBK” DJQ5120812018.shp public.DJQ5120812018 | psql -d shp2pgsqldemo -U postgres -W
示例  :shp2pgsql -s 4544 -c -W "UTF-8" ADDRESS.shp  public.rrrrr| psql -h 192.168.22.128 -d postgres -U postgres -W
                               编码格式  SHP数据    public下的rrrrr表        导入数据库地址     数据库名     用户名
也可分为两个步骤,先转换为sql语句,再导入,步骤同上
shp2pgsql -s 4544 -c -W “GBK” DJQ5120812018.shp>DJQ5120812018.sql
psql -d shp2pgsqldemo -U postgres -f DJQ5120812018.sql -W
可能出现的问题 解决办法
乱码 更改编码
导入中断,数据库无数据 数据过大
参数 含义
-s 空间参考标识符(SRID)
-d 重新建立表,并插入数据-a 在同一个表中增加数据
-c 建立新表,并插入数据(缺省)
-p 只创建表
-g 指定要创建的表的空间字段名称(在追加数据时有用)
-D 使用dump方式,比缺省生成sql的速度快
-G 使用类型geography
-k 保持标识符(列名,模式,属性)大小写。
-i 将所有整型都转为标准的32-bit整数
-I 在几何列上建立GIST索引
-S 生成简单几何,而非MULTI几何
-t 指定几何的维度
-w 指定输出格式为WKT
-W 输入的dbf文件编码方式
-N 指定几何为空时的操作
-n 只导入dbf文件
-T 指定表的表空间
-X 指定索引的表空间
-? 帮助
通过ogr2ogr转换为geojson
ogr2ogr -f "GeoJSON" ./asstln.json PG:"host=localhost dbname=postgres user=postgres password=111111" -sql "select * from asstln"
                       目标文件名          导出数据库连接信息                                                            导出表名
通过tippecanoe切片(参数自控)
单数据源
tippecanoe -e tracenln -pC -Z0 -z20 -f tracenln.json
              目标文件夹     切片等级空值   源文件名
单层多数据源合并
#where确定级别
ogr2ogr -f "GeoJSON" ./veg_py.json PG:"host=1.1.1.1 dbname=postgres user=postgres password=724111" -sql "select * from veg_py fscale=10"
tippecanoe -e tracenln -pC -Z0 -z20 -f tracenln1.json tracenln2.json tracenln3.json数据打包复制到编程端(传输更快)windows文件共享文件夹,或Tomcat,或在线服务器以便数据调用,注意解决触跨域资源访问
image-20210325142648372 准备mapbox2000 js css文件
windows 安装 git
Node.JS 安装说明
Yarn安装、配置、镜像源修改npm install --global yarn yarn --versionNode.js安装本地插件构建工具node-gyp
GitHub Mapbox源码地址:https://github.com/mapbox/mapbox-gl-js 2000坐标源码项目编译
yarn install
安装headless-gl,并将node_modules/headless-gl/deps/windows/dll/x64/*.dll 复制到c:\windows\system32
npm install gl
yarn run start-debug
yarn run build-dev准备好js和css文件
mapbox 前端代码导入地图数据并显示
3D模型
针对对应的建筑数据,进行建筑物3D显示
paint: { // 'fill-color': 'red', // 'fill-opacity': 1, 'fill-extrusion-color': '#f5f4ee', // use an 'interpolate' expression to add a smooth transition effect to the // buildings as the user zooms in 'fill-extrusion-height': [ "interpolate", ["linear"], ["zoom"], 15, 0, 15.05, ["get", "height"] ], 'fill-extrusion-base': [ "interpolate", ["linear"], ["zoom"], 15, 0, 15.05, ["get", "min_height"] ], 'fill-extrusion-opacity': 0.85 },vscode 插件服务器
插件安装 Live Server
准备图标数据,PBF字体数据
https://github.com/mapbox/spritezero
从零生成图标资源工具,可网上下载
生成如图形式文件,
filter 分类图标显示
'filter': [ 'any', [ '==', 'fcode', '4206002500'//2 ] ,[ '==', 'fcode', '4305010500'//2 ] ],分层数据显示
"layers": []//中越靠前的在底层细节优化(颜色,光,字体大小,图片大小)
控件加载
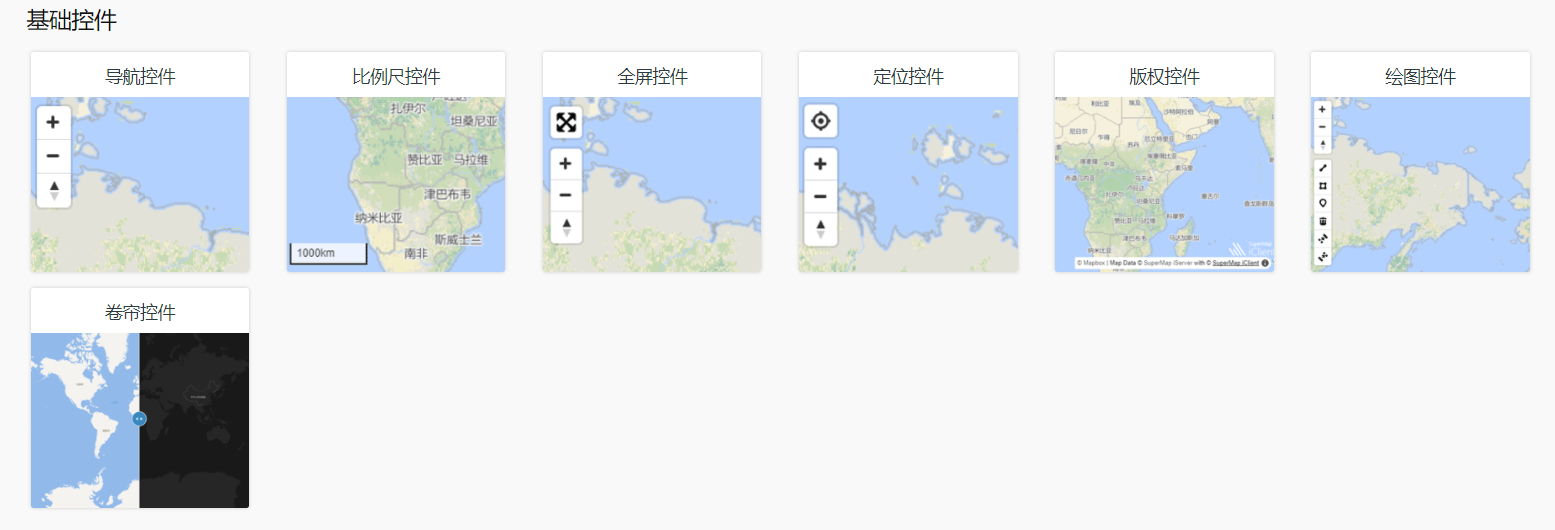
image-20210322154135351 加入点击显示相关信息
//弹出框 map.on('click', function (e) { var features = map.queryRenderedFeatures(e.point, { layers: ['13'] // replace this with the id of the layer }); if (!features.length) { return; } var feature = features[0]; var popup = new mapboxgl.Popup({ offset: [0, -15] }) .setLngLat(feature.geometry.coordinates) .setHTML('\<h3>' + feature.properties.shortname + '\</h3>\<p>' + feature.properties.name + '\</p>') .addTo(map); });wfts 底图切换
wfs,wms 数据加载(不同数据源)
定位
数据查询
数据可视化
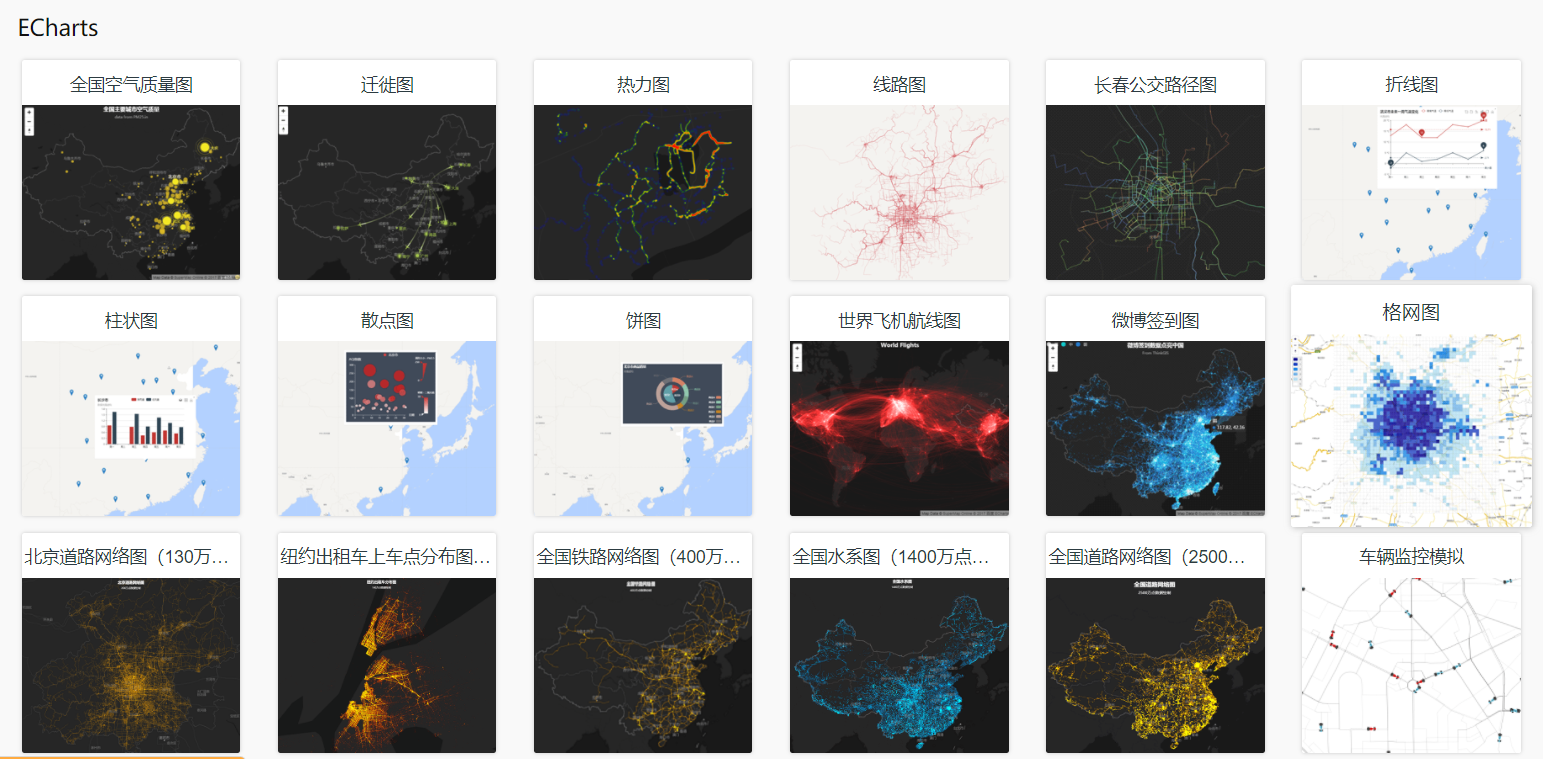
image-20210322154411490 优化
窗口样式优化,弹出框样式优化,字体等调节
一些小技巧
待更新
Mapbox源码编译
环境准备
GIT环境搭建:
详细点击:(一)windows 安装 git
Node.JS环境搭建:
详细点击:(一)Node.JS 安装说明
Yarn环境搭建:
详细点击:(一)Yarn安装、配置、镜像源修改
npm install --global yarn
yarn --versionNpm and node-gyp依赖安装
详细点击:(二)Node.js安装本地插件构建工具node-gyp
其他地址:
GitHub Mapbox源码地址:https://github.com/mapbox/mapbox-gl-js
项目编译
yarn install
安装headless-gl,并将node_modules/headless-gl/deps/windows/dll/x64/*.dll 复制到c:\windows\system32
npm install gl
yarn run start-debug
yarn run build-devdebug/index.html中代码最上方增加token
<script>
mapboxgl.accessToken='pk.eyJ1IjoibGltbiIsImEiOiJja2t1bG1na2IxZGU0MnZvNmlzY3FhZXM4In0.oQx4VguycOR4TK80Pyusmw';
var map = window.map = new mapboxgl.Map({
MAPBOX专业术语
矢量瓦片:
栅格瓦片:
MAPBOX学习
中文文档:http://www.mapbox.cn/mapbox-gl-js/api/
Styles (8)
为地图添加生成的图标
为地图添加动画图标
为地图生成及添加缺失的图标
为地图添加图标
使用自定义样式展示地图
显示卫星地图
改变一个地图的样式
显示一个地图
Layers (30)
用3D形式呈现建筑物
拉伸多边形以绘制3D室内地图
添加3D模型
调整图层不透明度
为线添加动画效果
为一系列图像添加动画效果
为点添加动画效果
按照缩放级别改变建筑颜色
更改标注的大小写
显示具有自定义属性的HTML聚类
创建样式聚类
使用按钮更改图层颜色
添加自定义样式图层
给线添加数据驱动属性的样式。
给圆添加数据驱动属性的样式
显示多种文本格式并设置其样式
为多边形添加图案
在标签下添加新图层
添加 GeoJSON 线
绘制 GeoJSON 点
添加 GeoJSON 多边形
创建热力图图层
添加晕暄
使用表达式创建渐变色线条
设置海洋深度数据样式
显示和隐藏图层
改变行政边界世界观
根据缩放级别更新等值线图层
变量标签位置
可视化人口密度
Sources (9)
将本地JSON数据与矢量切片图形连接
添加影像
添加实时数据
更新实时要素
添加栅格切片数据源
添加一个第三方矢量切片来源
添加一个矢量图片数据源
添加一个视频
添加一个 WMS 源
User interaction (17)
基于周边声音给3D建筑添加动画效果
禁用地图旋转
创建可拖动的点
创建可拖动的标记(Marker)
通过文本输入筛选符号
在 map view 中筛选要素
通过切换列表筛选符号
创建悬停效果
显示非交互式地图
更改地图的语言
高亮包含相似数据的部分
从点击点周围选择特征
限制地图平移在某一区域
获取鼠标下点的特征
切换交互
创建时间滑动条
高亮一个选择框范围内的特征
Camera (11)
使地图相机环绕一点运动
为路线中的点添加动画效果
将地图居中于被单击的符号上
缓慢飞至某个位置
将地图缩放至边界框内
飞至某一位置
使用游戏式控件浏览地图
跳至一系列地点
以幻灯片形式播放地图位置。
根据滚动位置飞到某处
设置 pitch 和 bearing
Controls and overlays (16)
为标记(marker)添加动画效果
改变注释的默认位置
使用 Markers 添加自定义图标
禁用滚轮缩放
全屏查看地图
定位用户
在不同地图之间滑动
显示驾驶方向
显示已绘制的多边形区域
添加地理编码器
利用地点名称添加标记
点击时显示多边形信息
悬浮时显示弹出窗
点击时显示一个弹出窗
显示一个弹出窗
将弹出窗口附加到 marker 实例
Geocoder (8)
从其他数据源中补充进一步的地理编码查询结果
接收输入坐标至地理编码器
使用地理编码器时采用自定义渲染功能
将地理编码的结果限制在指定地区范围内
在使用地理编码器的过程中结合使用自定义相机动画
在地图上添加位置搜索框
将地理编码器进行指定语言的本地化
在Geocoder产生结果后设置一个点
Browser support (1)
检查浏览器支持
Internationalization support (2)
使用本地生成的表意文字
为从右至左书写的脚本提供支持
SUPERMAP
一个mapbox华丽外衣与装备
Cusium
3D、2.5D、2D地图展示
源码解析准备
源码:下载
环境:node、npm
使用:VUE
运行:方法一:
- 解压
- 打开命令行,进入当前目录
- 安装依赖,输入:cnpm install,等待安装完成,然后输入: node server.js
$ cd ./Cesium-1.40
$ cnpm install  ...  Installed 37 packages  Linked 569 latest versions
$ npm start 或者 node server.js(新版本是 node server.cjs)
Cesium development server running locally.  Connect to http://localhost:8080/复制
方法二:
这里如果使用 express发布遇到问题,可以使用 http-server
$ npm install http-server -g
$ http-server -c-1 (如果只输入http-server,更新代码后,页面不会同步更新)
方法三:VSCode 插件运行
获取Token
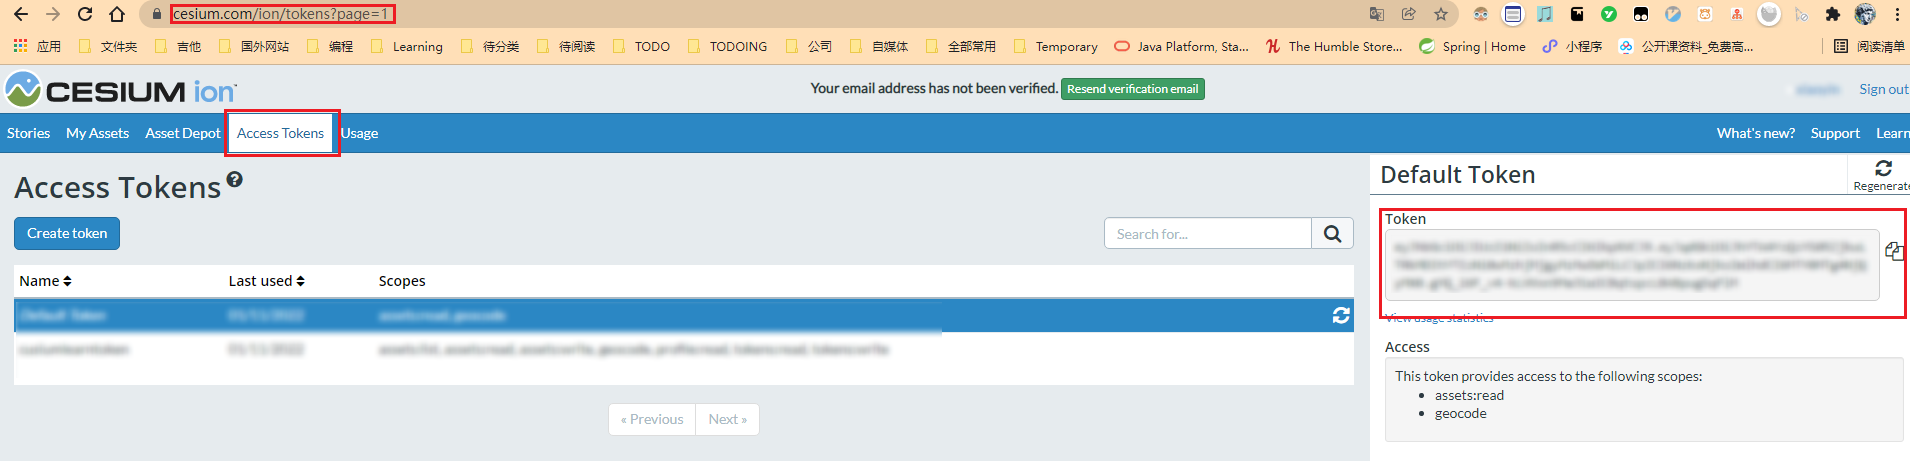
使用
    Cesium.Ion.defaultAccessToken = 'token';
    var viewer = new Cesium.Viewer("cesiumContainer", {})
源码目录结构说明
Apps 测试目录
Build 打包存放目录,源码是不包含这个目录的
Documentation API文档,很有用,是Cesium工具箱
launches Eclipse外部工具环境构建配置,直接为服务器运行node
Source 功能源码,核心部分
- Assets 纹理、图片等静态资源模块
Core 基础核心类、事件、颜色、矩阵、几何对象等
DataSources 数据源、数据对象、数据集合等
Renderer 渲染类、调度纹理、shader、缓冲区、顶点属性等
Scene 场景类、相机、模型加载器、地球、大气、相机、图层等
Shaders 静态Shader文件、shader模板
ThirdParty 第三方插件
Widgets Cesium的UI控件、时间轴、信息框、地图选择器等
Workers 工作线程、主要用于几何体的创建 ,支持多线程开发渲染
Specs 单元测试集
ThirdParty 第三方插件
Tools 打包、代码检查、jsdoc工具等
gulpfile.cjs 打包配置,包括GLSL语法的转义、压缩和未压缩库文件的打包、API文档的生成以及自动化单位测试等;
package.json 描述这个NPM包的所有相关信息、包括版本、依赖库、构建等信息;
index.html Cesium导航首页
主页说明
Cesium ion
Cesium ion is your hub for discovering 3D content and tiling your own data for streaming. CesiumJS and ion work together to enable you to build world class 3D mapping applications.
Sign up for a free account to get your access token required for using ion's Bing Maps global imagery and Cesium World Terrain assets.
Local links
| Documentation | The complete API documentation and reference. |
|---|---|
| Hello World | The simplest possible Cesium application. |
| Cesium Viewer | A sample Cesium reference application which allows you to browse the globe and select from a variety of imagery and terrain layers as well as load CZML, GeoJSON, and other formats supported by Cesium. |
| Sandcastle | Cesium's live code editor and example gallery. Browse examples highlighting features of the Cesium API and edit and run them all in your web browser. Cesium applications created in Sandcastle can be saved and downloaded. |
| Run tests | Run Cesium's full suite of unit tests |
External links
| Cesium | Learn about the Cesium team and the Cesium ion platform |
|---|---|
| Cesium Blog | Follow project news, developer tips, and posts about Cesium's innovative technology |
| Tutorials | Step-by-step guides for learning to use CesiumJS |
| Community Forum | Questions and feedback welcome from all skill levels |
| GitHub | The official CesiumJS GitHub repository |
| User Stories | Demos and information about projects using CesiumJS |
| WebGL Report | Provides technical information about WebGL capabilities supported by your browser |
界面介绍

自项目编写
环境:VUE2 ,cesium 1.89
C:\Users\Administrator>node -v
v14.16.0
C:\Users\Administrator>npm -v
6.14.11
项目创建
vue init webpack gislearn安装cesium 1.89
npm i cesium修改webpack.prod.conf.js
修改 --Cesium--标记处
'use strict'
const path = require('path')
const utils = require('./utils')
const webpack = require('webpack')
const config = require('../config')
const merge = require('webpack-merge')
const baseWebpackConfig = require('./webpack.base.conf')
const CopyWebpackPlugin = require('copy-webpack-plugin')
const HtmlWebpackPlugin = require('html-webpack-plugin')
const ExtractTextPlugin = require('extract-text-webpack-plugin')
const OptimizeCSSPlugin = require('optimize-css-assets-webpack-plugin')
const UglifyJsPlugin = require('uglifyjs-webpack-plugin')
// 定义路径--Cesium--
const cesiumSource = 'node_modules/cesium/Source'
const cesiumWorkers = '../Build/Cesium/Workers'

const env = process.env.NODE_ENV === 'testing'
  ? require('../config/test.env')
  : require('../config/prod.env')

const webpackConfig = merge(baseWebpackConfig, {
  module: {
    rules: utils.styleLoaders({
      sourceMap: config.build.productionSourceMap,
      extract: true,
      usePostCSS: true
    })
  },
  devtool: config.build.productionSourceMap ? config.build.devtool : false,
  output: {
    path: config.build.assetsRoot,
    filename: utils.assetsPath('js/[name].[chunkhash].js'),
    chunkFilename: utils.assetsPath('js/[id].[chunkhash].js')
  },
  plugins: [
    // 添加如下插件--Cesium--
    new CopyWebpackPlugin([{ from: path.join(cesiumSource, cesiumWorkers), to: 'Workers' }]),
    new CopyWebpackPlugin([{ from: path.join(cesiumSource, 'Assets'), to: 'Assets' }]),
    new CopyWebpackPlugin([{ from: path.join(cesiumSource, 'Widgets'), to: 'Widgets' }]),
    new CopyWebpackPlugin([{ from: path.join(cesiumSource, 'ThirdParty/Workers'), to: 'ThirdParty/Workers' }]),
    new webpack.DefinePlugin({
      // 注意这里和dev的配置不同
      // 定义Cesium从哪里加载资源,如果使用默认的'',却变成了绝对路径了,所以这里使用'./',使用相对路径
      CESIUM_BASE_URL: JSON.stringify('./')
    }),
    // http://vuejs.github.io/vue-loader/en/workflow/production.html
    new webpack.DefinePlugin({
      'process.env': env
    }),
    new UglifyJsPlugin({
      uglifyOptions: {
        compress: {
          warnings: false
        }
      },
      sourceMap: config.build.productionSourceMap,
      parallel: true
    }),
    // extract css into its own file
    new ExtractTextPlugin({
      filename: utils.assetsPath('css/[name].[contenthash].css'),
      // Setting the following option to `false` will not extract CSS from codesplit chunks.
      // Their CSS will instead be inserted dynamically with style-loader when the codesplit chunk has been loaded by webpack.
      // It's currently set to `true` because we are seeing that sourcemaps are included in the codesplit bundle as well when it's `false`,
      // increasing file size: https://github.com/vuejs-templates/webpack/issues/1110
      allChunks: true,
    }),
    // Compress extracted CSS. We are using this plugin so that possible
    // duplicated CSS from different components can be deduped.
    new OptimizeCSSPlugin({
      cssProcessorOptions: config.build.productionSourceMap
        ? { safe: true, map: { inline: false } }
        : { safe: true }
    }),
    // generate dist index.html with correct asset hash for caching.
    // you can customize output by editing /index.html
    // see https://github.com/ampedandwired/html-webpack-plugin
    new HtmlWebpackPlugin({
      filename: process.env.NODE_ENV === 'testing'
        ? 'index.html'
        : config.build.index,
      template: 'index.html',
      inject: true,
      minify: {
        removeComments: true,
        collapseWhitespace: true,
        removeAttributeQuotes: true
        // more options:
        // https://github.com/kangax/html-minifier#options-quick-reference
      },
      // necessary to consistently work with multiple chunks via CommonsChunkPlugin
      chunksSortMode: 'dependency'
    }),
    // keep module.id stable when vendor modules does not change
    new webpack.HashedModuleIdsPlugin(),
    // enable scope hoisting
    new webpack.optimize.ModuleConcatenationPlugin(),
    // split vendor js into its own file
    new webpack.optimize.CommonsChunkPlugin({
      name: 'vendor',
      minChunks(module) {
        // any required modules inside node_modules are extracted to vendor
        return (
          module.resource &&
          /\.js$/.test(module.resource) &&
          module.resource.indexOf(
            path.join(__dirname, '../node_modules')
          ) === 0
        )
      }
    }),
    // extract webpack runtime and module manifest to its own file in order to
    // prevent vendor hash from being updated whenever app bundle is updated
    new webpack.optimize.CommonsChunkPlugin({
      name: 'manifest',
      minChunks: Infinity
    }),
    // This instance extracts shared chunks from code splitted chunks and bundles them
    // in a separate chunk, similar to the vendor chunk
    // see: https://webpack.js.org/plugins/commons-chunk-plugin/#extra-async-commons-chunk
    new webpack.optimize.CommonsChunkPlugin({
      name: 'app',
      async: 'vendor-async',
      children: true,
      minChunks: 3
    }),

    // copy custom static assets
    new CopyWebpackPlugin([
      {
        from: path.resolve(__dirname, '../static'),
        to: config.build.assetsSubDirectory,
        ignore: ['.*']
      }
    ])
  ]
})

if (config.build.productionGzip) {
  const CompressionWebpackPlugin = require('compression-webpack-plugin')

  webpackConfig.plugins.push(
    new CompressionWebpackPlugin({
      asset: '[path].gz[query]',
      algorithm: 'gzip',
      test: new RegExp(
        '\\.(' +
        config.build.productionGzipExtensions.join('|') +
        ')$'
      ),
      threshold: 10240,
      minRatio: 0.8
    })
  )
}

if (config.build.bundleAnalyzerReport) {
  const BundleAnalyzerPlugin = require('webpack-bundle-analyzer').BundleAnalyzerPlugin
  webpackConfig.plugins.push(new BundleAnalyzerPlugin())
}

module.exports = webpackConfig
webpack.dev.conf.js
'use strict'
const utils = require('./utils')
const webpack = require('webpack')
const config = require('../config')
const merge = require('webpack-merge')
const path = require('path')
const baseWebpackConfig = require('./webpack.base.conf')
const CopyWebpackPlugin = require('copy-webpack-plugin')
const HtmlWebpackPlugin = require('html-webpack-plugin')
const FriendlyErrorsPlugin = require('friendly-errors-webpack-plugin')
const portfinder = require('portfinder')

const HOST = process.env.HOST
const PORT = process.env.PORT && Number(process.env.PORT)
// 定义路径:--Cesium--
const cesiumSource = 'node_modules/cesium/Source'
const cesiumWorkers = '../Build/Cesium/Workers'

const devWebpackConfig = merge(baseWebpackConfig, {
  module: {
    rules: utils.styleLoaders({ sourceMap: config.dev.cssSourceMap, usePostCSS: true })
  },
  // cheap-module-eval-source-map is faster for development
  devtool: config.dev.devtool,

  // these devServer options should be customized in /config/index.js
  devServer: {
    clientLogLevel: 'warning',
    historyApiFallback: {
      rewrites: [
        { from: /.*/, to: path.posix.join(config.dev.assetsPublicPath, 'index.html') },
      ],
    },
    hot: true,
    contentBase: false, // since we use CopyWebpackPlugin.
    compress: true,
    host: HOST || config.dev.host,
    port: PORT || config.dev.port,
    open: config.dev.autoOpenBrowser,
    overlay: config.dev.errorOverlay
      ? { warnings: false, errors: true }
      : false,
    publicPath: config.dev.assetsPublicPath,
    proxy: config.dev.proxyTable,
    quiet: true, // necessary for FriendlyErrorsPlugin
    watchOptions: {
      poll: config.dev.poll,
    }
  },
  plugins: [
    // 添加如下插件--Cesium--
    new CopyWebpackPlugin([{ from: path.join(cesiumSource, cesiumWorkers), to: 'Workers' }]),
    new CopyWebpackPlugin([{ from: path.join(cesiumSource, 'Assets'), to: 'Assets' }]),
    new CopyWebpackPlugin([{ from: path.join(cesiumSource, 'Widgets'), to: 'Widgets' }]),
    new CopyWebpackPlugin([{ from: path.join(cesiumSource, 'ThirdParty/Workers'), to: 'ThirdParty/Workers' }]),
    new webpack.DefinePlugin({
      // Define relative base path in cesium for loading assets
      CESIUM_BASE_URL: JSON.stringify('')
    }),


    new webpack.DefinePlugin({
      'process.env': require('../config/dev.env')
    }),
    new webpack.HotModuleReplacementPlugin(),
    new webpack.NamedModulesPlugin(), // HMR shows correct file names in console on update.
    new webpack.NoEmitOnErrorsPlugin(),
    // https://github.com/ampedandwired/html-webpack-plugin
    new HtmlWebpackPlugin({
      filename: 'index.html',
      template: 'index.html',
      inject: true
    }),
    // copy custom static assets
    new CopyWebpackPlugin([
      {
        from: path.resolve(__dirname, '../static'),
        to: config.dev.assetsSubDirectory,
        ignore: ['.*']
      }
    ])
  ]
})

module.exports = new Promise((resolve, reject) => {
  portfinder.basePort = process.env.PORT || config.dev.port
  portfinder.getPort((err, port) => {
    if (err) {
      reject(err)
    } else {
      // publish the new Port, necessary for e2e tests
      process.env.PORT = port
      // add port to devServer config
      devWebpackConfig.devServer.port = port

      // Add FriendlyErrorsPlugin
      devWebpackConfig.plugins.push(new FriendlyErrorsPlugin({
        compilationSuccessInfo: {
          messages: [`Your application is running here: http://${devWebpackConfig.devServer.host}:${port}`],
        },
        onErrors: config.dev.notifyOnErrors
          ? utils.createNotifierCallback()
          : undefined
      }))

      resolve(devWebpackConfig)
    }
  })
})
webpack.base.conf.js
'use strict'
const path = require('path')
const utils = require('./utils')
const config = require('../config')
const vueLoaderConfig = require('./vue-loader.conf')
//定义 Cesium 源码路径  --Cesium--
const cesiumSource = '../node_modules/cesium/Source'
const cesiumWorkers = path.join(cesiumSource, 'Workers');
function resolve(dir) {
  return path.join(__dirname, '..', dir)
}

const createLintingRule = () => ({
  test: /\.(js|vue)$/,
  loader: 'eslint-loader',
  enforce: 'pre',
  include: [resolve('src'), resolve('test')],
  options: {
    formatter: require('eslint-friendly-formatter'),
    emitWarning: !config.dev.showEslintErrorsInOverlay
  }
})

module.exports = {
  context: path.resolve(__dirname, '../'),
  entry: {
    app: './src/main.js'
  },
  // output: {
  //   path: config.build.assetsRoot,
  //   filename: '[name].js',
  //   publicPath: process.env.NODE_ENV === 'production'
  //     ? config.build.assetsPublicPath
  //     : config.dev.assetsPublicPath
  // },

  // 让webpack正确处理多行字符串,在output中添加sourcePrefix:' '--Cesium--
  output: {
    path: config.build.assetsRoot,
    filename: '[name].js',
    publicPath: process.env.NODE_ENV === 'production'
      ? config.build.assetsPublicPath
      : config.dev.assetsPublicPath,
    sourcePrefix: ' ' //让webpack正确处理多行字符串
  },
  // resolve: {
  //   extensions: ['.js', '.vue', '.json'],
  //   alias: {
  //     'vue$': 'vue/dist/vue.esm.js',
  //     '@': resolve('src'),
  //   }
  // },

  // 需要在resolve中设置cesium别名,这样在引入的时候就可以根据别名找到Cesium的包。--Cesium--
  // (注:也可以不设置别名,导包是直接导入'cesium/Source/Cesium.js'就行。其实设置别名的目的就是让“别名”指向/ node_modules / cesium / Source目录)
  resolve: {
    extensions: ['.js', '.vue', '.json'],
    alias: {
      'vue$': 'vue/dist/vue.esm.js',
      '@': resolve('src'),
      cesium: path.resolve(__dirname, cesiumSource) //设置cesium别名
    }
  },
  module: {
    // 解决报错 1.87版本无效,只能暂时退版本--Cesium--
    // npm install @open-wc/webpack-import-meta-loader --save-dev
    //  error  in ./node_modules/cesium/Source/ThirdParty/zip.js
    // Module parse failed: Unexpected token(6400:57)
    // You may need an appropriate loader to handle this file type.
    rules: [
      {
        test: /\.js$/,
        use: {
          loader: '@open-wc/webpack-import-meta-loader',
        },
      },
      // 创建工程师会选择 ESLint 代码校验
      //  Use ESLint to lint your code? Yes
      // ...(config.dev.useEslint ? [createLintingRule()] : []),
      {
        test: /\.vue$/,
        loader: 'vue-loader',
        options: vueLoaderConfig
      },
      {
        test: /\.js$/,
        loader: 'babel-loader',
        include: [resolve('src'), resolve('test'), resolve('node_modules/webpack-dev-server/client')]
      },
      {
        test: /\.(png|jpe?g|gif|svg)(\?.*)?$/,
        loader: 'url-loader',
        options: {
          limit: 10000,
          name: utils.assetsPath('img/[name].[hash:7].[ext]')
        }
      },
      {
        test: /\.(mp4|webm|ogg|mp3|wav|flac|aac)(\?.*)?$/,
        loader: 'url-loader',
        options: {
          limit: 10000,
          name: utils.assetsPath('media/[name].[hash:7].[ext]')
        }
      },
      {
        test: /\.(woff2?|eot|ttf|otf)(\?.*)?$/,
        loader: 'url-loader',
        options: {
          limit: 10000,
          name: utils.assetsPath('fonts/[name].[hash:7].[ext]')
        }
      }
    ],
    unknownContextCritical: false,//阻止依赖警告--Cesium--
  },
  node: {
    // prevent webpack from injecting useless setImmediate polyfill because Vue
    // source contains it (although only uses it if it's native).
    setImmediate: false,
    // prevent webpack from injecting mocks to Node native modules
    // that does not make sense for the client
    dgram: 'empty',
    fs: 'empty',
    net: 'empty',
    tls: 'empty',
    child_process: 'empty'
  }
}
创建地图组件 src\view\earth.vue
\<template>
  \<div class="container">
    \<div id="cesiumContainer">\</div>
    \<div id="credit">\</div>
  \</div>
\</template>

\<script>
// 这里不能使用 import Cesium from 'cesium/Cesium' 导入模块,因为Cesium 1.63 版本以后使用的是ES6。应该使用以下方式
// import { Viewer } from "cesium/Cesium";
import * as Cesium from "cesium/Cesium"; //正确
import "cesium/Widgets/widgets.css";
export default {
  name: "earth",
  data() {
    return {};
  },
  mounted() {
    // let viewer = new Viewer("cesiumContainer");
    // 1. Geocoder : 查找位置工具,查找到之后会将镜头对准找到的地址,默认使用bing地图
    // 2. Home Button :视角返回初始位置.
    // 3. Scene Mode Picker : 选择视角的模式,有三种:3D,2D,哥伦布视图(CV)
    // 4. Base Layer Picker : 图层选择器,选择要显示的地图服务和地形服务.
    // 5. Navigation Help Button :导航帮助按钮,显示默认的地图控制帮助.
    // 6. Animation : 动画器件,控制视图动画的播放速度.
    // 7. Timeline :时间线,指示当前时间,并允许用户跳到特定的时间.
    // 8. Credits Display :版权显示,显示数据归属,必选
    // 9. Fullscreen Button :全屏按钮.
    Cesium.Ion.defaultAccessToken ="自己的token";
    var viewer = new Cesium.Viewer("cesiumContainer", {
      // geocoder: false,
      // homeButton: false,
      // sceneModePicker: false,
      // baseLayerPicker: false,
      // navigationHelpButton: false,
      // animation: false,
      creditContainer: "credit",
      // timeline: false,
      // fullscreenButton: false,
      // vrButton: false,
      // skyBox : new Cesium.SkyBox({
      //     sources : {
      //     positiveX : 'stars/TychoSkymapII.t3_08192x04096_80_px.jpg',
      //     negativeX : 'stars/TychoSkymapII.t3_08192x04096_80_mx.jpg',
      //     positiveY : 'stars/TychoSkymapII.t3_08192x04096_80_py.jpg',
      //     negativeY : 'stars/TychoSkymapII.t3_08192x04096_80_my.jpg',
      //     positiveZ : 'stars/TychoSkymapII.t3_08192x04096_80_pz.jpg',
      //     negativeZ : 'stars/TychoSkymapII.t3_08192x04096_80_mz.jpg'
      //     }
      // })
    });
    // 显示帧速(FPS)
    viewer.scene.debugShowFramesPerSecond = true;
    // 绘制形状
    // 方式一:
    var redBox = viewer.entities.add({
      name: "Red box with black outline",
      position: Cesium.Cartesian3.fromDegrees(-107.0, 40.0, 300000.0),
      box: {
        dimensions: new Cesium.Cartesian3(400000.0, 300000.0, 500000.0),
        material: Cesium.Color.BLUE.withAlpha(0.5),
        outline: true,
        outlineColor: Cesium.Color.BLACK,
      },
    });

    viewer.zoomTo(viewer.entities);

    // 方式二:
    var czml = [
      {
        id: "document",
        name: "box",
        version: "1.0",
      },
      {
        id: "shape2",
        name: "Red box with black outline",
        position: {
          cartographicDegrees: [-107.0, 50.0, 300000.0],
        },
        box: {
          dimensions: {
            cartesian: [400000.0, 300000.0, 500000.0],
          },
          material: {
            solidColor: {
              color: {
                rgba: [255, 0, 0, 128],
              },
            },
          },
          outline: true,
          outlineColor: {
            rgba: [0, 0, 0, 255],
          },
        },
      },
    ];
    // 重复创建Viewer会添加多个窗口
    // var viewer = new Cesium.Viewer("cesiumContainer");
    var dataSourcePromise = Cesium.CzmlDataSource.load(czml);
    viewer.dataSources.add(dataSourcePromise);
    viewer.zoomTo(dataSourcePromise);
  },
};
\</script>

\<style scoped>
.container {
  width: 100%;
  height: 100%;
}
#cesiumContainer {
  width: 100%;
  height: 100%;
}

/* 不占据空间,无法点击,右上角按钮组,左下角动画控件 ,时间线,logo信息*/
/* .cesium-viewer-toolbar,
.cesium-viewer-animationContainer,
.cesium-viewer-timelineContainer,
.cesium-viewer-bottom {
  display: none;
} */
/* 全屏按钮 */
/* .cesium-viewer-fullscreenContainer  {
  position: absolute;
  top: -999em;
} */

/* 注:全屏按钮不能通过display:none的方式来达到隐藏的目的,这是因为生成的按钮控件的行内样式设置了display属性,会覆盖引入的css属性

\<div class="cesium-viewer-fullscreenContainer" style="display: block;">...\</div> */
\</style>
添加路由 src\router\index.js
import Vue from 'vue'
import Router from 'vue-router'
import HelloWorld from '@/components/HelloWorld'
import earth from '@/view/earth'

Vue.use(Router)

export default new Router({
  routes: [
    {
      path: '/',
      name: 'HelloWorld',
      component: HelloWorld
    },
    {
      path: '/earth',
      name: 'earth',
      component: earth
    }
  ]
})
运行报错1
error in ./node_modules/cesium/Source/ThirdParty/zip.js
解决
npm i @open-wc/webpack-import-meta-loader -Svue.config.js 或 webpack.base.conf.js配置
module.exports = {
    configureWebpack: {
        module: {
            rules: [
                {
                    test: /\.js$/,
                    use: {
                        loader: '@open-wc/webpack-import-meta-loader',
                    },
                },
            ],
        },
    },
}
运行报错2
error in (webpack)/hot/dev-server.js
Module build failed: TypeError: Cannot read property 'length' of undefined
at Object.module.exports (F:\demo\cesiumtest-master\node_modules@open-wc\webpack-import-meta-loader\webpack-import-meta-loader.js:20:63)
解决
点击报错跳转到对应文件行,将其注释即可
module.exports = function (source) {
  const path = require('path');

  const relativePath = this.context.substring(
    // this.context.indexOf(this.rootContext) + this.rootContext.length + 1,
    this.resource.lastIndexOf(path.sep) + 1,
  );
运行
npm run dev
npm run build 打包成功
部署dist
http://xx.xx.xx.11:8084/#/earth 成功
常用API
坐标转换
Cesium:各种坐标转换_51CTO博客_cesium坐标转换
功能开发
控件显示控制
- Geocoder : 查找位置工具,查找到之后会将镜头对准找到的地址,默认使用bing地图
- Home Button :视角返回初始位置.
- Scene Mode Picker : 选择视角的模式,有三种:3D,2D,哥伦布视图(CV)
- Base Layer Picker : 图层选择器,选择要显示的地图服务和地形服务.
- Navigation Help Button :导航帮助按钮,显示默认的地图控制帮助.
- Animation : 动画器件,控制视图动画的播放速度.
- Timeline :时间线,指示当前时间,并允许用户跳到特定的时间.
- Credits Display :版权显示,显示数据归属,必选
- Fullscreen Button :全屏按钮.
js方式
    var viewer = new Viewer("cesiumContainer", {
      geocoder: false,
      homeButton: false,
      sceneModePicker: false,
      baseLayerPicker: false,
      navigationHelpButton: false,
      animation: false,
      // creditContainer: "credit",
      timeline: false,
      fullscreenButton: false,
      vrButton: false,
      // skyBox : new Cesium.SkyBox({
      //     sources : {
      //     positiveX : 'stars/TychoSkymapII.t3_08192x04096_80_px.jpg',
      //     negativeX : 'stars/TychoSkymapII.t3_08192x04096_80_mx.jpg',
      //     positiveY : 'stars/TychoSkymapII.t3_08192x04096_80_py.jpg',
      //     negativeY : 'stars/TychoSkymapII.t3_08192x04096_80_my.jpg',
      //     positiveZ : 'stars/TychoSkymapII.t3_08192x04096_80_pz.jpg',
      //     negativeZ : 'stars/TychoSkymapII.t3_08192x04096_80_mz.jpg'
      //     }
      // })
    });
    // 显示帧速(FPS)
    viewer.scene.debugShowFramesPerSecond = true;
css方式
      /* 不占据空间,无法点击 */
      .cesium-viewer-toolbar,             /* 右上角按钮组 */
      .cesium-viewer-animationContainer,  /* 左下角动画控件 */
      .cesium-viewer-timelineContainer,   /* 时间线 */
      .cesium-viewer-bottom               /* logo信息 */
      {
        display: none;
      }
      .cesium-viewer-fullscreenContainer  /* 全屏按钮 */
      { position: absolute; top: -999em;  }
创建形状

// 绘制形状  正方体
    // 方式一:Entity
//其他形状:http://cesium.xin/cesium/Documentation/Entity.html?classFilter=entity
    var redBox = viewer.entities.add({
      name: "Red box with black outline",
      position: Cesium.Cartesian3.fromDegrees(-107.0, 40.0, 300000.0),
      box: {
        dimensions: new Cesium.Cartesian3(400000.0, 300000.0, 500000.0),
        material: Cesium.Color.BLUE.withAlpha(0.5),
        outline: true,
        outlineColor: Cesium.Color.BLACK,
      },
    });

    viewer.zoomTo(viewer.entities);

    // 方式二:CZML(可创建几何形状也可创建动画)
    var czml = [
      {
        id: "document",
        name: "box",
        version: "1.0",
      },
      {
        id: "shape2",
        name: "Red box with black outline",
        position: {
          cartographicDegrees: [-107.0, 50.0, 300000.0],
        },
        box: {
          dimensions: {
            cartesian: [400000.0, 300000.0, 500000.0],
          },
          material: {
            solidColor: {
              color: {
                rgba: [255, 0, 0, 128],
              },
            },
          },
          outline: true,
          outlineColor: {
            rgba: [0, 0, 0, 255],
          },
        },
      },
    ];
    // 重复创建Viewer会添加多个窗口
    // var viewer = new Cesium.Viewer("cesiumContainer");
    var dataSourcePromise = Cesium.CzmlDataSource.load(czml);
    viewer.dataSources.add(dataSourcePromise);
    viewer.zoomTo(dataSourcePromise);
添加不同类型数据
Web Map Service (WMS) - 一种OGC标准,从分布式地理数据库中通过地图的地理范围来请求切片。 Cesium使用 WebMapServiceImageryProvider去支持这种。
Tile Map Service (TMS) - 一种访问地图切片的REST接口。 可以用CesiumLab, MapTiler 或者 GDAL2Tiles . Cesium中使用TileMapServiceImageryProvider.
OpenGIS Web Map Tile Service (WMTS) - 一种OGC标准,主要是为预渲染的地图切片形式. Cesium中使用 WebMapTileServiceImageryProvider.
OpenStreetMap - 访问 OpenStreetMap 切片 或者 任意 Slippy map tiles.有很多方法 发布这种服务 .Cesium中使用createOpenStreetMapImageryProvider.
Bing 地图 - 使用Bing 地图 REST 服务访问切片. 在这里 https://www.bingmapsportal.com/创建Bing地图的key. Cesium中使用 BingMapsImageryProvider.
Esri ArcGIS MapServer - 使用 ArcGIS Server REST API 访问存储在ArcGIS Server上的切片。Cesium中使用ArcGisMapServerImageryProvider.
Google Earth Enterprise - 访问Google Earth 企业版服务器发布的影像切片。Cesium中 GoogleEarthImageryProvider.
Mapbox - 使用 Mapbox API访问切片. 在这里新建用户,并且创建一个 access token. Cesium中使用 MapboxImageryProvider.
普通图片文件 - 使用一张普通图片创建影像图层. Cesium中使用 SingleTileImageryProvider.
自定义切片机制 - 使用UrlTemplateImageryProvider, 可以通过 URL 模板连接各种影像资源 。比如TMS服务的URL模板是:
//cesiumjs.org/tilesets/imagery/naturalearthii/{z}/{x}/{reverseY}.jpg.切片坐标 - 用来显示全球是如何被切片的,支持多种切片规则,画出每个切片的地理边界,并且用文字标注每个切片的level,x,y坐标。
百度地图 - 用来加载百度默认地图或者自定义样式地图,请联系我们。
3D Tiles
跨域问题解决
module.exports = {

  dev: {

    // Paths
    assetsSubDirectory: 'static',
    assetsPublicPath: '/',
    //接口地址原本是/satellite/z={z}&x={x}&y={y} 但是为了匹配代理地址 调用时需在前面加一个 /satellite,  因此接口地址需要写成这样的即可生效 /satellite/satellite/z={z}&x={x}&y={y}
    proxyTable: {
      '/ArcGIS': {//代理的目的:只要是/satellite开头的路径都往localhost:3000进行转发
        target: 'https://sampleserver1.arcgisonline.com', //后端接口地址 设置代理服务器地址 转发地址
        ws: true,//WebSocket协议
        changeOrigin: true, //表示是否改变原域名;这个一定要选择为true; 是否允许跨域[ 如果接口跨域 则要配置这个参数]
        secure: false, // 如果是https接口 需要配置这个参数
        pathRewrite: {// 把程序中的地址转换成“真实地址”+‘/satellite’后面的部分如‘/satellite/satellite/z={z}&x={x}&y={y}',被转换成'http://localhost:3000/satellite/z={z}&x={x}&y={y}'
          '^/ArcGIS': ''//修改pathRewrite地址 将前缀'^satellite'转为'/satellite'
        }
      },
    },
加载不同类型数据
 // 加载不同类型数据 从上到下依次覆盖==============================================

    // 数据类型1: -----------------------------------Web Map Service (WMS) -------------------------------------
    // var provider = new Cesium.WebMapServiceImageryProvider({
    //   // url: "https://sampleserver1.arcgisonline.com/ArcGIS/services/Specialty/ESRI_StatesCitiesRivers_USA/MapServer/WMSServer",
    //   url: "ArcGIS/ArcGIS/services/Specialty/ESRI_StatesCitiesRivers_USA/MapServer/WMSServer",
    //   layers: "0",
    //   // proxy: new Cesium.DefaultProxy("/proxy/"),
    // });
    // viewer.imageryLayers.addImageryProvider(provider);

    // 数据类型2:-----------------------------------OpenGIS Web Map Tile Service (WMTS)-----------------------------------
    // var shadedRelief2 = new Cesium.WebMapTileServiceImageryProvider({
    //   url: "http://basemap.nationalmap.gov/arcgis/rest/services/USGSShadedReliefOnly/MapServer/WMTS/tile/1.0.0/USGSShadedReliefOnly/{Style}/{TileMatrixSet}/{TileMatrix}/{TileRow}/{TileCol}.jpg",
    //   layer: "USGSShadedReliefOnly",
    //   style: "default",
    //   format: "image/jpeg",
    //   tileMatrixSetID: "default028mm",
    //   maximumLevel: 19,
    //   credit: new Cesium.Credit("U. S. Geological Survey"),
    // });
    // viewer.imageryLayers.addImageryProvider(shadedRelief2);
    // url:"http://61.175.211.102/arcgis/rest/services/wzmap/map/MapServer/WMTS?service=WMTS&request=GetTile&layer=wzmap&style=default&tilematriX={TileMatrix}&tilerow={TileRow}&tilecoL={TileCol}"

    // 数据类型3: -----------------------------------Tile Map Service (TMS)-----------------------------------
    // var tms = new Cesium.TileMapServiceImageryProvider({
    //   url: "../images/cesium_maptiler/Cesium_Logo_Color",
    //   fileExtension: "png",
    //   maximumLevel: 4,
    //   rectangle: new Cesium.Rectangle(
    //     Cesium.Math.toRadians(-120.0),
    //     Cesium.Math.toRadians(20.0),
    //     Cesium.Math.toRadians(-60.0),
    //     Cesium.Math.toRadians(40.0)
    //   ),
    // });
    // viewer.imageryLayers.addImageryProvider(tms);

    // 数据类型4: -----------------------------------ArcGis-----------------------------------
    // var esri = new Cesium.ArcGisMapServerImageryProvider({
    //   url: "https://services.arcgisonline.com/ArcGIS/rest/services/World_Imagery/MapServer",
    // });
    // viewer.imageryLayers.addImageryProvider(esri);

    // 数据类型5:-----------------------------------Mapbox-----------------------------------
    var mapbox = new Cesium.MapboxImageryProvider({
      mapId: "mapbox.mapbox-streets-v8",
      accessToken:
        "pk.eyJ1IjoibGltbiIsImEiOiJja2t1bG1na2IxZGU0MnZvNmlzY3FhZXM4In0.oQx4VguycOR4TK80Pyusmw",
    });
    viewer.imageryLayers.addImageryProvider(mapbox);
模型裁剪
<template>
  <div>
    <div id="geologyClipPlanDiv" v-drag v-show="showClipping">
      <table style="text-align: right">
        <tr>
          <td colspan="2" style="text-align: left">
            <span style="font-size: 18px; font-weight: 600">模型裁剪</span>
            <!-- <div
              class="closerGeologyClipPlan"
              @click="handCloserGeologyClipPlan"
            ></div> -->
          </td>
        </tr>
        <tr>
          <td colspan="2">
            <div
              style="
                height: 4px;
                background-color: rgba(29, 164, 220, 0.6);
                margin: 4px;
              "
            ></div>
          </td>
        </tr>
        <tr>
          <td>裁剪类型:</td>
          <td>
            <el-radio v-model="modelType" label="0">外部裁剪</el-radio>
            <el-radio v-model="modelType" label="1">内部裁剪</el-radio>
          </td>
        </tr>
        <tr>
          <td colspan="2">
            <el-button
              size="mini"
              :disabled="isDrawGeologyClipPlan"
              @click="drawGeologyClipPlan"
              >绘制裁剪范围</el-button
            >
            <el-button size="mini" @click="clearGeologyClipPlan"
              >清除</el-button
            >
          </td>
        </tr>
      </table>
    </div>
  </div>
</template>
<script>
import * as turf from "@turf/turf";

let geologyClipPlanObj = null;
let handlerGeologyClipPlan = null;
let floatingPointList = [];
let activeShapePoints = [];

let floatingPoint = undefined;
let activeShape = undefined;

let my3dtiles = undefined;
let drawList = [];
let inverseTransform = undefined;

export default {
  name: "geologyClipPlan",
  data() {
    return {
      isDrawGeologyClipPlan: false,
      modelType: "0", // 开挖深度
      showClipping: true,
      currentViewer: null,
    };
  },
  props: {
    viewers: {
      type: Object,
    },
  },
  created() {},

  methods: {
    handCloserGeologyClipPlan() {
      this.showClipping = false;
      self.$parent.currentData.active = false;
      this.$parent.hearderTabItemActive = "";
      this.clearGeologyClipPlan();
    },

    drawGeologyClipPlan() {
      this.clearGeologyClipPlan();
      // my3dtiles =this.viewer;
      this.isDrawGeologyClipPlan = true;

      inverseTransform = this.getInverseTransform(my3dtiles);

      this.viewer._container.style.cursor = "pointer";

      // 取消双击事件-追踪该位置
      this.viewer.cesiumWidget.screenSpaceEventHandler.removeInputAction(
        Cesium.ScreenSpaceEventType.LEFT_DOUBLE_CLICK
      );

      handlerGeologyClipPlan = new Cesium.ScreenSpaceEventHandler(
        this.viewer.scene.canvas
      );

      handlerGeologyClipPlan.setInputAction((event) => {
        if (
          !my3dtiles.clippingPlanes ||
          !my3dtiles.clippingPlanes._planes.length
        ) {
          const pick = this.viewer.scene.pickPosition(event.position);
          const pickWGS = this.cart3ToWGS(pick);
          const pickModel = this.viewer.scene.pick(event.position);
          my3dtiles = pickModel.primitive;
          if (pickModel) {
            drawList.push(pickWGS);

            if (activeShapePoints.length === 0) {
              floatingPoint = this.createPoint(pick);
              floatingPointList.push(floatingPoint);
              activeShapePoints.push(pick);
              var dynamicPositions = new Cesium.CallbackProperty(function () {
                return new Cesium.PolygonHierarchy(activeShapePoints);
              }, false);
              activeShape = this.drawShape(dynamicPositions);
            }
            activeShapePoints.push(pick);
            floatingPointList.push(this.createPoint(pick));
          }
        }
      }, Cesium.ScreenSpaceEventType.LEFT_CLICK);

      handlerGeologyClipPlan.setInputAction((event) => {
        if (Cesium.defined(floatingPoint)) {
          var newPosition = this.viewer.scene.pickPosition(event.endPosition);
          if (Cesium.defined(newPosition)) {
            floatingPoint.position.setValue(newPosition);
            activeShapePoints.pop();
            activeShapePoints.push(newPosition);
          }
        }
      }, Cesium.ScreenSpaceEventType.MOUSE_MOVE);

      handlerGeologyClipPlan.setInputAction((event) => {
        if (
          !my3dtiles.clippingPlanes ||
          !my3dtiles.clippingPlanes._planes.length
        ) {
          if (drawList.length < 3) {
            this.$message({
              message: "提示:需要绘制三个以上点, 请继续绘制!",
              type: "warning",
            });
          } else {
            this.terminateShape();
            const unionClippingRegions = this.modelType === "0" ? true : false;
            drawList = this.isDirRes(drawList, unionClippingRegions);
            const Planes = [];
            for (let i = 0; i < drawList.length; i++) {
              if (i === drawList.length - 1) {
                Planes.push(
                  this.createPlane(drawList[i], drawList[0], inverseTransform)
                );
              } else {
                Planes.push(
                  this.createPlane(
                    drawList[i],
                    drawList[i + 1],
                    inverseTransform
                  )
                );
              }
            }
            console.log(Planes);
            const PlaneCollection = new Cesium.ClippingPlaneCollection({
              planes: Planes,
              unionClippingRegions, // 再做优化
            });
            my3dtiles.clippingPlanes = PlaneCollection;
          }

          handlerGeologyClipPlan.removeInputAction(
            Cesium.ScreenSpaceEventType.LEFT_CLICK
          );
          handlerGeologyClipPlan.removeInputAction(
            Cesium.ScreenSpaceEventType.RIGHT_CLICK
          );
          handlerGeologyClipPlan.removeInputAction(
            Cesium.ScreenSpaceEventType.MOUSE_MOVE
          );
          handlerGeologyClipPlan = null;
          this.isDrawGeologyClipPlan = false;
          this.viewer._container.style.cursor = "default";
        }
      }, Cesium.ScreenSpaceEventType.RIGHT_CLICK);
    },

    getInverseTransform(tileSet) {
      let transform;
      const tmp = tileSet.root.transform;
      if ((tmp && tmp.equals(Cesium.Matrix4.IDENTITY)) || !tmp) {
        transform = Cesium.Transforms.eastNorthUpToFixedFrame(
          tileSet.boundingSphere.center
        );
      } else {
        transform = Cesium.Matrix4.fromArray(tileSet.root.transform);
      }
      return Cesium.Matrix4.inverseTransformation(
        transform,
        new Cesium.Matrix4()
      );
    },

    cart3ToWGS(cart3) {
      return {
        lat: Cesium.Math.toDegrees(
          Cesium.Cartographic.fromCartesian(cart3).latitude
        ),
        lng: Cesium.Math.toDegrees(
          Cesium.Cartographic.fromCartesian(cart3).longitude
        ),
      };
    },

    createPlane(p1, p2, inverseTransform) {
      // 将仅包含经纬度信息的p1,p2,转换为相应坐标系的cartesian3对象
      const p1C3 = this.getOriginCoordinateSystemPoint(p1, inverseTransform);
      const p2C3 = this.getOriginCoordinateSystemPoint(p2, inverseTransform);

      // 定义一个垂直向上的向量up
      const up = new Cesium.Cartesian3(0, 0, 10);
      //  right 实际上就是由p1指向p2的向量
      const right = Cesium.Cartesian3.subtract(
        p2C3,
        p1C3,
        new Cesium.Cartesian3()
      );

      // 计算normal, right叉乘up,得到平面法向量,这个法向量指向right的右侧
      let normal = Cesium.Cartesian3.cross(right, up, new Cesium.Cartesian3());
      normal = Cesium.Cartesian3.normalize(normal, normal);

      // 由于已经获得了法向量和过平面的一点,因此可以直接构造Plane,并进一步构造ClippingPlane
      const planeTmp = Cesium.Plane.fromPointNormal(p1C3, normal);
      return Cesium.ClippingPlane.fromPlane(planeTmp);
    },

    getOriginCoordinateSystemPoint(point, inverseTransform) {
      const val = Cesium.Cartesian3.fromDegrees(point.lng, point.lat);
      return Cesium.Matrix4.multiplyByPoint(
        inverseTransform,
        val,
        new Cesium.Cartesian3(0, 0, 0)
      );
    },

    clearGeologyClipPlan() {
      floatingPointList = [];
      activeShapePoints = [];
      if (geologyClipPlanObj) {
        geologyClipPlanObj.clear();
        geologyClipPlanObj = null;
      }
      this.isDrawGeologyClipPlan = false;
      // if (this.TilesetsList.length > 0) {
      //   let tilestObj = this.TilesetsList[0].tileset;
      //   tilestObj.clippingPlanes
      //     ? (tilestObj.clippingPlanes.removeAll(),
      //       (tilestObj.clippingPlanes = undefined))
      //     : "";
      // }
      // my3dtiles.clippingPlanes.removeAll();
      if (
        this.pickedFeature.clippingPlanes &&
        this.pickedFeature.clippingPlanes.length > 0
      ) {
        this.pickedFeature.clippingPlanes.removeAll();
      }

      my3dtiles = this.pickedFeature;
      drawList = [];
    },

    isDirRes(polygon, isClockwise) {
      var lineStringList = [];
      polygon.forEach((p) => {
        lineStringList.push([p.lng, p.lat]);
      });

      var clockwiseRing = turf.lineString(lineStringList);
      let isR = turf.booleanClockwise(clockwiseRing);

      var points = [];
      if (isClockwise) {
        if (!isR) {
          points = polygon;
        } else {
          var count = 0;
          for (var ii = polygon.length - 1; ii >= 0; ii--) {
            points[count] = polygon[ii];
            count++;
          }
        }
      } else {
        if (isR) {
          points = polygon;
        } else {
          var count = 0;
          for (var ii = polygon.length - 1; ii >= 0; ii--) {
            points[count] = polygon[ii];
            count++;
          }
        }
      }
      return points;
    },

    drawShape(positionData) {
      var shape = this.viewer.entities.add({
        polygon: {
          hierarchy: positionData,
          material: new Cesium.ColorMaterialProperty(
            Cesium.Color.BLUE.withAlpha(0.2)
          ),
        },
      });
      return shape;
    },

    createPoint(worldPosition) {
      var point = this.viewer.entities.add({
        position: worldPosition,
        point: {
          color: Cesium.Color.RED,
          pixelSize: 5,
          heightReference: Cesium.HeightReference.CLAMP_TO_GROUND,
        },
      });
      return point;
    },

    terminateShape() {
      activeShapePoints.pop();
      var pol = this.drawShape(activeShapePoints);
      floatingPointList.forEach((p) => {
        this.viewer.entities.remove(p);
      });
      this.viewer.entities.remove(floatingPoint);
      this.viewer.entities.remove(activeShape);
      this.viewer.entities.remove(pol);
      floatingPoint = undefined;
      activeShape = undefined;

      activeShapePoints = [];
    },
  },
};
</script>

<style lang="scss" scoped>
.closerGeologyClipPlan {
  text-decoration: none;
  position: absolute;
  top: 20px;
  right: 10px;
  z-index: 20;
}
.closerGeologyClipPlan:after {
  // content: "✖";
  content: "\e60b";
  font-family: "iconfont";
  font-size: 22px;
  color: rgba($color: gray, $alpha: 0.8);
}

#geologyClipPlanDiv {
  color: #25bbbb;
  background: rgba(4, 32, 37, 0.8);
  border-radius: 6px;
  padding: 10px;
  top: 700px;
  margin-left: 50px;
  position: fixed;
  // margin-top: 300px;
  .closerGeologyClipPlan {
    top: 1vh;
    right: 0.6vw;
    cursor: pointer;
  }

  /deep/ .el-button {
    background: rgba(18, 167, 204, 0.52);
    color: #25bbbb;
    border: 0px;
  }

  /deep/ .el-radio__inner {
    background-color: rgba(18, 167, 204, 0.82);
    border: 1px solid rgba(0, 185, 241, 1);
  }
  /deep/ .el-radio {
    color: #25bbbb;
    margin-right: 10px;
  }
}

#geologyClipPlanDiv td {
  padding: 4px 2px;
}
</style>
模型压平
地表裁剪挖坑
<template>
  <div class="home" v-drag>
    <!-- <el-row type="flex" :gutter="20">
      <el-col :span="24">
        <div class="grid-content bg-purple">
          <el-button type="primary" @click="draw('polygon')"
            >绘制裁切面</el-button
          >
          <el-button type="primary" @click="clearAll">清空所有数据</el-button>
        </div>
      </el-col>
    </el-row> -->
    <table id="geologyClipPlanDiv">
      <tr>
        <td>
          <span style="font-size: 18px; font-weight: 600">地表裁剪</span>
          <!-- <div
              class="closerGeologyClipPlan"
              @click="handCloserGeologyClipPlan"
            ></div> -->
        </td>
      </tr>
      <tr>
        <td>
          <div
            style="
              height: 4px;
              background-color: rgba(29, 164, 220, 0.6);
              margin: 4px;
            "
          ></div>
        </td>
      </tr>
      <tr>
        <td>
          <el-button size="mini" @click="draw('polygon')" class="drawButton"
            >绘制切面</el-button
          >
          <el-button size="mini" @click="clearAll" class="drawButton"
            >清空数据</el-button
          >
        </td>
      </tr>
    </table>
  </div>
</template>

<script>
import TerrainClipPlan from "@/core/TerrainClipPlan";
export default {
  name: "clipping_single",
  data() {
    return {
      _viewer: undefined,
      terrainClipPlan: undefined,
      isClipping: false,
      tempEntities: [],
      clippingPoints: [],
    };
  },
  components: {},
  mounted() {
    this.init();
  },
  beforeDestroy() {
    this.clearAll();
  },
  methods: {
    init() {
      this._viewer = this.viewer;
      this.addDem();
      this.draw();
    },
    addDem() {
      let that = this;
      // that._viewer.terrainProvider = new Cesium.CesiumTerrainProvider({
      //   url: "../dem/ASTGTM_N29E087D",
      // });
      // that._viewer.camera.flyTo({
      //   destination: Cesium.Cartesian3.fromDegrees(
      //     87.42919921875,
      //     28.700224692776988,
      //     67863.0
      //   ),
      //   orientation: {
      //     heading: Cesium.Math.toRadians(0.0),
      //     pitch: Cesium.Math.toRadians(-45.0),
      //     roll: 0.0,
      //   },
      // });
    },
    clippings() {
      let that = this;
      let clippingPoints = this.clippingPoints;
      //将第一个点添加到最后一个点,完成闭环
      clippingPoints.push(clippingPoints[0]);
      // 将点集合逆转
      let newClippingPoints = clippingPoints.reverse();
      // truf判断多边形坐标是否为顺时针,true:顺时针,false:逆时针
      // console.log(turf.booleanClockwise(turf.lineString(clippingPoints)));
      // let clippingPlanes1 = that.createClippingPlane(newClippingPoints);
      that._viewer.scene.globe.depthTestAgainstTerrain = true;
      // that._viewer.scene.globe.clippingPlanes =
      //   new Cesium.ClippingPlaneCollection({
      //     planes: clippingPlanes1,
      //     edgeWidth: 1.0,
      //     edgeColor: Cesium.Color.YELLOW,
      //   });

      // let clippingPlanes = new Cesium.ClippingPlaneCollection({
      //   planes: clippingPlanes1,
      //   edgeWidth: 1.0,
      //   edgeColor: Cesium.Color.YELLOW,
      // });

      // let clippingPlanes = new Cesium.ClippingPlaneCollection({
      //   planes: [
      //     new Cesium.ClippingPlane(new Cesium.Cartesian3(0.0, 0.0, -1.0), 0.0),
      //   ],
      //   edgeWidth: 1.0,
      // });
      // const entity = that._viewer.entities.add({
      //   position: Cesium.Cartesian3.fromDegrees(120.131173, 30.330447, 0),
      //   model: {
      //     uri: "../../static/models/cesiumMan/Cesium_Man.glb",
      //     clippingPlanes: clippingPlanes,
      //   },
      // });
      // that._viewer.zoomTo(entity);
      // that._viewer.scene.globe.clippingPlanes =
      //     new Cesium.ClippingPlaneCollection({
      //       planes: clippingPlanes1,
      //       edgeWidth: 1.0,
      //       edgeColor: Cesium.Color.YELLOW,
      //     });
      //         tileset = new Cesium.Cesium3DTileset({
      //   url: that.tileUrl,
      //   clippingPlanes: clippingPlanes1,
      //   unionClippingRegions: true,
      //   modelMatrix: Matrix4,
      // });
      // that.tileset = tileset;
      // viewer.scene.primitives.add(tileset);
      // viewer.zoomTo(tileset);
      // console.log(tileset);

      // that.add3DtilesModel(
      //   that._viewer,
      //   "http://126.15.15.152:807/static/v1/tileset.json",
      //   2,
      //   "model-3dmax",
      //   {
      //     id: "1719",
      //     pid: "3198",
      //     text: "方案A",
      //     address: "http://126.15.15.152:807/static/v1/tileset.json",
      //     dimensionType: "3D",
      //     modelIdentity: "model-3dmax",
      //     modelLayerid: "",
      //     modelSoilHeight: "2",
      //     isRoot: "",
      //     interfaceType: "GeoJSON",
      //     modelPositionCalibration: "120.1320,30.3299,0",
      //     displayName: "",
      //     displayLevel: "",
      //     transparency: "",
      //     initPosition: "",
      //     isShow: "1",
      //     children: [],
      //     toumingdu: 80,
      //     newCalibrationPosition: "120.1320,30.3299,0",
      //   },
      //   that._viewer.scene.globe.clippingPlanes
      // );
    },
    getAllSet(value) {
      const self = this;
      let params = {
        pageSize: 1000,
        pageNo: 1,
      };
      let result = "";
      $.ajaxSettings.async = false;
      $.post(config.baseURL + "/digitalcity/query", params, function (res) {
        res.data.resultList.forEach((item) => {
          if (item.RESOURCENAME == value) {
            result = item.RESOURCEVALUE;
          }
        });
      });
      return result;
    },
    add3DtilesModel(viewer, url, height, type, node, clippingPlanes) {
      const self = this;
      // viewer.scene.globe.depthTestAgainstTerrain = true;
      console.log(
        "viewer.scene.globe.clippingPlanes",
        viewer.scene.globe.clippingPlanes
      );

      var tileset = new Cesium.Cesium3DTileset({
        url: url,
        clippingPlanes: clippingPlanes,
        // unionClippingRegions: true,
        // skipLevelOfDetail: true,
        preferLeaves: true,
        //  maximumScreenSpaceError: self.getAllSet("modelMaxScreenError"),
        lightColor: new Cesium.Cartesian3(
          self.getAllSet("modelLightColor"),
          self.getAllSet("modelLightColor"),
          self.getAllSet("modelLightColor")
        ),
      });
      viewer.scene.primitives.add(tileset);
      tileset.type = type;

      if (node) {
        if (node.initPosition || node.INIT_POSITION) {
          let p = node.initPosition ? node.initPosition : node.INIT_POSITION;
          let positions = p.split(",");
          viewer.camera.flyTo({
            destination: Cesium.Cartesian3.fromDegrees(
              positions[0],
              positions[1],
              positions[2]
            ),
          });
        } else {
          viewer.zoomTo(tileset);
          //viewer.zoomTo(tileset, new Cesium.HeadingPitchRange(0.0, -90.0, 3000));
        }
      } else {
        viewer.zoomTo(tileset);
      }
      tileset.readyPromise
        .then(function () {
          if (height) {
            height = Number(height);
            if (isNaN(height)) {
              return;
            }
          }
          var cartographic = Cesium.Cartographic.fromCartesian(
            tileset.boundingSphere.center
          );
          console.log("long", cartographic.longitude);
          console.log("lat", cartographic.latitude);
          var surface = Cesium.Cartesian3.fromRadians(
            cartographic.longitude,
            cartographic.latitude,
            0.0
          );
          var offset = Cesium.Cartesian3.fromRadians(
            cartographic.longitude,
            cartographic.latitude,
            height
          );
          var translation = Cesium.Cartesian3.subtract(
            offset,
            surface,
            new Cesium.Cartesian3()
          );
          tileset.modelMatrix = Cesium.Matrix4.fromTranslation(translation);
          if (node.newCalibrationPosition) {
            let p = node.newCalibrationPosition;
            let positions = p.split(",");
            console.log(positions);
            // 模型的位置坐标(三维笛卡尔坐标)。Cartesian3
            var position = Cesium.Cartesian3.fromDegrees(
              positions[0],
              positions[1],
              positions[2]
            );
            // 模型的位置矩阵(WGS84 Matrix4)。
            var mat = Cesium.Transforms.eastNorthUpToFixedFrame(position);
            tileset._root.transform = mat;
          }
        })
        .otherwise(function (error) {
          console.log(error);
        });
      return tileset;
    },
    draw() {
      let that = this;
      //每次裁切前清空多边形数据
      that.clearDrawEntities();
      let viewer = this._viewer;
      let tempEntities = this.tempEntities;
      let position = [];
      let tempPoints = [];
      let handler = new Cesium.ScreenSpaceEventHandler(viewer.scene.canvas);
      //鼠标移动事件
      handler.setInputAction(function (movement) {},
      Cesium.ScreenSpaceEventType.MOUSE_MOVE);
      //左键点击操作
      handler.setInputAction(function (click) {
        // 从相机位置通过windowPosition 世界坐标中的像素创建一条射线。返回Cartesian3射线的位置和方向。
        let ray = viewer.camera.getPickRay(click.position);
        // 查找射线与渲染的地球表面之间的交点。射线必须以世界坐标给出。返回Cartesian3对象
        position = viewer.scene.globe.pick(ray, viewer.scene);
        //将笛卡尔坐标转换为地理坐标
        let cartographic =
          viewer.scene.globe.ellipsoid.cartesianToCartographic(position);
        //将弧度转为度的十进制度表示
        let longitudeString = Cesium.Math.toDegrees(cartographic.longitude);
        let latitudeString = Cesium.Math.toDegrees(cartographic.latitude);
        let points = [longitudeString, latitudeString];
        // 将点坐标添加到数组中
        that.clippingPoints.push(points);
        tempPoints.push(position);
        let tempLength = tempPoints.length;
        //调用绘制点的接口
        let point = that.drawPoint(position);
        tempEntities.push(point);
        if (tempLength > 1) {
          let pointline = that.drawPolyline([
            tempPoints[tempPoints.length - 2],
            tempPoints[tempPoints.length - 1],
          ]);
          tempEntities.push(pointline);
        } else {
          // tooltip.innerHTML = "请绘制下一个点,右键结束";
        }
      }, Cesium.ScreenSpaceEventType.LEFT_CLICK);
      //右键点击操作

      handler.setInputAction(function (click) {
        let cartesian = viewer.camera.pickEllipsoid(
          click.position,
          viewer.scene.globe.ellipsoid
        );

        if (cartesian) {
          let tempLength = tempPoints.length;
          if (tempLength < 3) {
            alert("请选择3个以上的点再执行闭合操作命令");
          } else {
            //闭合最后一条线
            let pointline = that.drawPolyline([
              tempPoints[tempPoints.length - 1],
              tempPoints[0],
            ]);
            tempEntities.push(pointline);
            // that.drawPolygon(tempPoints);
            tempEntities.push(tempPoints);
            that.clippings();
            handler.destroy(); //关闭事件句柄
            handler = null;
          }

          that.terrainClipPlan = new TerrainClipPlan(viewer, {
            height: 60,
            splitNum: 1000,
            bottomImg: "/static/img/content/bottom.png",
            wallImg: "/static/img/content/wall.png",
          });
          that.terrainClipPlan.updateData(tempPoints);
        }
      }, Cesium.ScreenSpaceEventType.RIGHT_CLICK);
    },
    drawPoint(position, config) {
      let viewer = this._viewer;
      let config_ = config ? config : {};
      return viewer.entities.add({
        name: "点几何对象",
        position: position,
        point: {
          color: Cesium.Color.SKYBLUE,
          pixelSize: 10,
          outlineColor: Cesium.Color.YELLOW,
          outlineWidth: 3,
          disableDepthTestDistance: Number.POSITIVE_INFINITY,
          heightReference: Cesium.HeightReference.CLAMP_TO_GROUND,
        },
      });
    },
    drawPolyline(positions, config_) {
      let viewer = this._viewer;
      if (positions.length < 1) return;
      let config = config_ ? config_ : {};
      return viewer.entities.add({
        name: "线几何对象",
        polyline: {
          positions: positions,
          width: config.width ? config.width : 5.0,
          material: new Cesium.PolylineGlowMaterialProperty({
            color: config.color
              ? new Cesium.Color.fromCssColorString(config.color)
              : Cesium.Color.GOLD,
          }),
          depthFailMaterial: new Cesium.PolylineGlowMaterialProperty({
            color: config.color
              ? new Cesium.Color.fromCssColorString(config.color)
              : Cesium.Color.GOLD,
          }),
          clampToGround: true,
        },
      });
    },
    drawPolygon(positions, config_) {
      let viewer = this._viewer;
      if (positions.length < 2) return;
      let config = config_ ? config_ : {};
      return viewer.entities.add({
        name: "面几何对象",
        polygon: {
          hierarchy: positions,
          material: config.color
            ? new Cesium.Color.fromCssColorString(config.color).withAlpha(0.2)
            : new Cesium.Color.fromCssColorString("#FFD700").withAlpha(0.2),
        },
      });
    },
    /**
     * 根据多边形数组创建裁切面
     * @param points_ 多边形数组集合
     * @returns {[]} 返回裁切面数组
     */
    // createClippingPlane(points_) {
    //   let points = [];
    //   for (let i = 0; i < points_.length - 1; i++) {
    //     points.push(
    //       Cesium.Cartesian3.fromDegrees(points_[i][0], points_[i][1])
    //     );
    //   }
    //   let pointsLength = points.length;
    //   let clippingPlanes = []; // 存储ClippingPlane集合
    //   for (let i = 0; i < pointsLength; ++i) {
    //     let nextIndex = (i + 1) % pointsLength;
    //     let midpoint = Cesium.Cartesian3.add(
    //       points[i],
    //       points[nextIndex],
    //       new Cesium.Cartesian3()
    //     );
    //     midpoint = Cesium.Cartesian3.multiplyByScalar(midpoint, 0.5, midpoint);

    //     let up = Cesium.Cartesian3.normalize(midpoint, new Cesium.Cartesian3());
    //     let right = Cesium.Cartesian3.subtract(
    //       points[nextIndex],
    //       midpoint,
    //       new Cesium.Cartesian3()
    //     );
    //     right = Cesium.Cartesian3.normalize(right, right);

    //     let normal = Cesium.Cartesian3.cross(
    //       right,
    //       up,
    //       new Cesium.Cartesian3()
    //     );
    //     normal = Cesium.Cartesian3.normalize(normal, normal);

    //     let originCenteredPlane = new Cesium.Plane(normal, 0.0);
    //     let distance = Cesium.Plane.getPointDistance(
    //       originCenteredPlane,
    //       midpoint
    //     );

    //     clippingPlanes.push(new Cesium.ClippingPlane(normal, distance));
    //   }
    //   return clippingPlanes;
    // },
    /**
     * 清除实体
     */
    clearDrawEntities() {
      let viewer = this._viewer;
      this.tempEntities = [];
      this.clippingPoints = [];
      // 清除之前的实体
      const entitys = viewer.entities._entities._array;
      let length = entitys.length;
      // 倒叙遍历防止实体减少之后entitys[f]不存在
      for (let f = length - 1; f >= 0; f--) {
        if (
          entitys[f]._name &&
          (entitys[f]._name === "点几何对象" ||
            entitys[f]._name === "线几何对象" ||
            entitys[f]._name === "面几何对象")
        ) {
          viewer.entities.remove(entitys[f]);
        }
      }
      if (this.terrainClipPlan) {
        this.terrainClipPlan.clear();
      }
    },
    clearAll() {
      let that = this;
      this.clearDrawEntities();
      that._viewer.scene.globe.clippingPlanes = null;
      if (this.terrainClipPlan) {
        this.terrainClipPlan.clear();
      }
    },
  },
  created() {},
};
</script>

<style scoped>
#geologyClipPlanDiv {
  margin: 5%;
}
.drawButton {
  color: #25bbbb;
  background: rgba(4, 32, 37, 0.8);
}
.home {
  color: #25bbbb;
  background: rgba(4, 32, 37, 0.8);
  border-radius: 6px;
  top: 200px;
  /* right: 10%; */
  position: fixed;
  width: 200px;
  padding: 0;
  /* overflow-y: auto;
  overflow-x: hidden; */
}
</style>
function TerrainClipPlan(t, i) {
    this.viewer = t,
        this.options = i || {},
        this._positions = i.positions,
        this._height = this.options.height || 0,
        this.bottomImg = i.bottomImg,
        this.wallImg = i.wallImg,
        this.splitNum = Cesium.defaultValue(i.splitNum, 50),
        this._positions && this._positions.length > 0 && this.updateData(this._positions)
}

Object.defineProperties(TerrainClipPlan.prototype, {
    show: {
        get: function () {
            return this._show
        },
        set: function (e) {
            this._show = e, this.viewer.scene.globe.clippingPlanes && (this.viewer.scene.globe.clippingPlanes.enabled = e), this._switchExcavate(e)
        }
    },

    height: {
        get: function () {
            return this._height
        },
        set: function (e) {
            this._height = e, this._updateExcavateDepth(e)
        }
    }
})


TerrainClipPlan.prototype.updateData = function (e) {
    this.clear();
    var t = [],
        i = e.length,
        a = new Cesium.Cartesian3,
        n = Cesium.Cartesian3.subtract(e[0], e[1], a);
    n = n.x > 0, this.excavateMinHeight = 9999;
    for (var r = 0; r < i; ++r) {
        var s = (r + 1) % i,
            u = Cesium.Cartographic.fromCartesian(e[r]),
            c = this.viewer.scene.globe.getHeight(u) || u.height;
        c < this.excavateMinHeight && (this.excavateMinHeight = c);

        var midpoint = Cesium.Cartesian3.add(e[r], e[s], new Cesium.Cartesian3());
        midpoint = Cesium.Cartesian3.multiplyByScalar(midpoint, 0.5, midpoint);

        var up = Cesium.Cartesian3.normalize(midpoint, new Cesium.Cartesian3());
        var right = Cesium.Cartesian3.subtract(e[s], midpoint, new Cesium.Cartesian3());
        right = Cesium.Cartesian3.normalize(right, right);

        var normal = Cesium.Cartesian3.cross(right, up, new Cesium.Cartesian3());
        normal = Cesium.Cartesian3.normalize(normal, normal);

        var originCenteredPlane = new Cesium.Plane(normal, 0.0);
        var distance = Cesium.Plane.getPointDistance(originCenteredPlane, midpoint);

        t.push(new Cesium.ClippingPlane(normal, distance));
    }
    this.viewer.scene.globe.clippingPlanes = new Cesium.ClippingPlaneCollection({
        planes: t,
        edgeWidth: 1,
        edgeColor: Cesium.Color.WHITE,
        enabled: !0
    }), this._prepareWell(e), this._createWell(this.wellData)
}

TerrainClipPlan.prototype.clear = function () {

    this.viewer.scene.globe.clippingPlanes && (this.viewer.scene.globe.clippingPlanes.enabled = !1, this.viewer.scene.globe.clippingPlanes.removeAll(), this.viewer.scene.globe.clippingPlanes.isDestroyed() || this.viewer.scene.globe.clippingPlanes.destroy()), this.viewer.scene.globe.clippingPlanes = void 0, this.bottomSurface && this.viewer.scene.primitives.remove(this.bottomSurface), this.wellWall && this.viewer.scene.primitives.remove(this.wellWall), delete this.bottomSurface, delete this.wellWall, this.viewer.scene.render()
}

TerrainClipPlan.prototype._prepareWell = function (e) {
    var t = this.splitNum,
        i = e.length;
    if (0 != i) {
        for (var a = this.excavateMinHeight - this.height, n = [], r = [], s = [], l = 0; l < i; l++) {
            var u = l == i - 1 ? 0 : l + 1,
                c = Cesium.Cartographic.fromCartesian(e[l]),
                d = Cesium.Cartographic.fromCartesian(e[u]),
                h = [c.longitude, c.latitude],
                f = [d.longitude, d.latitude];

            0 == l && (
                s.push(new Cesium.Cartographic(h[0], h[1])),
                r.push(Cesium.Cartesian3.fromRadians(h[0], h[1], a)),
                n.push(Cesium.Cartesian3.fromRadians(h[0], h[1], 0)));

            for (var p = 1; p <= t; p++) {
                var m = Cesium.Math.lerp(h[0], f[0], p / t),
                    g = Cesium.Math.lerp(h[1], f[1], p / t);
                l == i - 1 && p == t || (
                    s.push(new Cesium.Cartographic(m, g)),
                    r.push(Cesium.Cartesian3.fromRadians(m, g, a)),
                    n.push(Cesium.Cartesian3.fromRadians(m, g, 0)))
            }
        }
        this.wellData = {
            lerp_pos: s,
            bottom_pos: r,
            no_height_top: n
        }
    }
}

TerrainClipPlan.prototype._createWell = function (e) {
    if (Boolean(this.viewer.terrainProvider._layers)) {
        var t = this;
        this._createBottomSurface(e.bottom_pos);
        var i = Cesium.sampleTerrainMostDetailed(this.viewer.terrainProvider, e.lerp_pos);
        Cesium.when(i, function (i) {
            for (var a = i.length, n = [], r = 0; r < a; r++) {
                var s = Cesium.Cartesian3.fromRadians(i[r].longitude, i[r].latitude, i[r].height);
                n.push(s)
            }
            t._createWellWall(e.bottom_pos, n)
        })
    } else {
        this._createBottomSurface(e.bottom_pos);
        this._createWellWall(e.bottom_pos, e.no_height_top)
    }
}


TerrainClipPlan.prototype._getMinHeight = function (e) {
    let minHeight = 5000000;
    let minPoint = null;
    for (let i = 0; i < e.length; i++) {
        let height = e[i]['z'];
        if (height < minHeight) {
            minHeight = height;
            minPoint = this._ellipsoidToLonLat(e[i]);
        }
    }
    return minPoint.altitude;
}


TerrainClipPlan.prototype._ellipsoidToLonLat = function (c) {
    let ellipsoid = this.viewer.scene.globe.ellipsoid;
    let cartesian3 = new Cesium.Cartesian3(c.x, c.y, c.z);
    let cartographic = ellipsoid.cartesianToCartographic(cartesian3);
    let lat = Cesium.Math.toDegrees(cartographic.latitude);
    let lng = Cesium.Math.toDegrees(cartographic.longitude);
    let alt = cartographic.height;
    return {
        longitude: lng,
        latitude: lat,
        altitude: alt
    }
}
TerrainClipPlan.prototype._createBottomSurface = function (e) {
    if (e.length) {
        let minHeight = this._getMinHeight(e);
        let positions = [];
        for (let i = 0; i < e.length; i++) {
            let p = this._ellipsoidToLonLat(e[i]);
            positions.push(p.longitude);
            positions.push(p.latitude);
            positions.push(minHeight);
        }

        let polygon = new Cesium.PolygonGeometry({
            polygonHierarchy: new Cesium.PolygonHierarchy(
                Cesium.Cartesian3.fromDegreesArrayHeights(positions)
            ),
            perPositionHeight: true,
            closeBottom: false
        });
        let geometry = Cesium.PolygonGeometry.createGeometry(polygon);


        var i = new Cesium.Material({
            fabric: {
                type: "Image",
                uniforms: {
                    image: this.bottomImg
                }
            }
        }),
            a = new Cesium.MaterialAppearance({
                translucent: !1,
                flat: !0,
                material: i
            });
        this.bottomSurface = new Cesium.Primitive({
            geometryInstances: new Cesium.GeometryInstance({
                geometry: geometry
            }),
            appearance: a,
            asynchronous: !1
        }), this.viewer.scene.primitives.add(this.bottomSurface)
    }
}

TerrainClipPlan.prototype._createWellWall = function (e, t) {
    let minHeight = this._getMinHeight(e);
    let maxHeights = [];
    let minHeights = [];
    for (let i = 0; i < t.length; i++) {
        maxHeights.push(this._ellipsoidToLonLat(t[i]).altitude);
        minHeights.push(minHeight);
    }
    let wall = new Cesium.WallGeometry({
        positions: t,
        maximumHeights: maxHeights,
        minimumHeights: minHeights,
    });
    let geometry = Cesium.WallGeometry.createGeometry(wall);
    var a = new Cesium.Material({
        fabric: {
            type: "Image",
            uniforms: {
                image: this.wallImg
            }
        }
    }),
        n = new Cesium.MaterialAppearance({
            translucent: !1,
            flat: !0,
            material: a
        });
    this.wellWall = new Cesium.Primitive({
        geometryInstances: new Cesium.GeometryInstance({
            geometry: geometry,
            attributes: {
                color: Cesium.ColorGeometryInstanceAttribute.fromColor(Cesium.Color.GREY)
            },
            id: "PitWall"
        }),
        appearance: n,
        asynchronous: !1
    }), this.viewer.scene.primitives.add(this.wellWall)
}
TerrainClipPlan.prototype._switchExcavate = function (e) {
    e ? (this.viewer.scene.globe.material = Cesium.Material.fromType("WaJue"), this.wellWall.show = !0, this.bottomSurface.show = !0) : (this.viewer.scene.globe.material = null, this.wellWall.show = !1, this.bottomSurface.show = !1)
}

TerrainClipPlan.prototype._updateExcavateDepth = function (e) {
    this.bottomSurface && this.viewer.scene.primitives.remove(this.bottomSurface), this.wellWall && this.viewer.scene.primitives.remove(this.wellWall);
    for (var t = this.wellData.lerp_pos, i = [], a = t.length, n = 0; n < a; n++) i.push(Cesium.Cartesian3.fromRadians(t[n].longitude, t[n].latitude, this.excavateMinHeight - e));
    this.wellData.bottom_pos = i, this._createWell(this.wellData), this.viewer.scene.primitives.add(this.bottomSurface), this.viewer.scene.primitives.add(this.wellWall)
}

export default TerrainClipPlan
三维分析
Leaflet
an open-source JavaScript library for mobile-friendly interactive maps
Leaflet 是一个为建设移动设备友好的互动地图,而开发的现代的、开源的 JavaScript 库。虽然代码仅有 38 KB,但它具有开发人员开发在线地图的大部分功能。Leaflet设计坚持简便、高性能和可用性好的思想,在所有主要桌面和移动平台能高效运作,在现代浏览器上会利用HTML5和CSS3的优势,同时也支持旧的浏览器访问。支持插件扩展,有一个友好、易于使用的API文档和一个简单的、可读的源代码。详细见官方网站https://leafletjs.com/
3.3.1地图
3.3.1.1矢量电子地图
\<html>
\<head>
\<meta charset="UTF-8">
\<title>添加电子地图\</title>
<!--添加leaflet样式-->
\<link rel="stylesheet" href="http://1.1.1.1:8082/leaflet/V1.3/leaflet/leaflet.css" />
<!--添加leafletjs包-->
\<script src="http://1.1.1.1:8082/leaflet/V1.3/leaflet/leaflet.js">\</script>
<!--添加坐标库-->
\<script src="http://1.1.1.1:8082/leaflet/V1.3/pro/proj4-compressed.js">\</script>
\<script src="http://1.1.1.1:8082/leaflet/V1.3/pro/proj4leaflet.js">\</script>
\<style>
html {
height: 100%
}
body {
height: 100%;
margin: 0;
padding: 0;
}
.map {
height: 100%
}
\</style>
\</head>
\<body>
\<div id="mapid" class="map">\</div>
\<script>
var res = [
0.00549933137239034, // Level 0
0.00274966568619517, // Level 1
0.00137483284309758, // Level 2
0.000687416421548792, // Level 3
0.000343708210774396, // Level 4
0.000171854105387198,
8.5927052693599E-05,
4.29635263467995E-05,
2.14817631733998E-05,
1.07408815866999E-05,
5.37044079334994E-06,
2.68522039667497E-06,
1.34261019833748E-06
];
var crs = new L.Proj.CRS('EPSG:4490',
'+proj=longlat +ellps=GRS80 +no_defs',
{
resolutions: res,
origin: [118.122911693886, 31.2869311022836], //切图原点
}
);
var map = L.map('mapid', {
crs: crs
});
var url = "http://1.1.1.1:8080/68DE38F71E38CD8C508FAB3035752EA8ED8F9221EDE18FDBE593B01FCDD12BD296F09FE27CD7D2733AD075EAF994851B/PBS/rest/services/hzsyvector/Mapserver";
var attrib = "© 杭州市规划资源局";
var basemap = new L.TileLayer(url + "/tile/{z}/{y}/{x}", {
tileSize: 256,
attribution: attrib
});
map.addLayer(basemap);
map.setView([30.25168, 120.16179], 4); //设置比例尺和中心点级别
\</script>
\</body>
\</html>3.3.1.2影像电子地图
\<!DOCTYPE html>
\<html>
\<head>
\<meta charset="UTF-8">
\<title>添加影像地图\</title>
\<link rel="stylesheet" href="http://1.1.1.1:8082/leaflet/V1.3/leaflet/leaflet.css" />
\<script src="http://1.1.1.1:8082/leaflet/V1.3/leaflet/leaflet.js">\</script>
\<script src="http://1.1.1.1:8082/leaflet/V1.3/pro/proj4-compressed.js">\</script>
\<script src="http://1.1.1.1:8082/leaflet/V1.3/pro/proj4leaflet.js">\</script>
\<style>
html {
height: 100%
}
body {
height: 100%;
margin: 0;
padding: 0;
}
.map {
height: 100%
}
\</style>
\</head>
\<body>
\<div id="mapid" class="map">\</div>
\<script>
var res = [
0.00549933137239034, // Level 0
0.00274966568619517, // Level 1
0.00137483284309758, // Level 2
0.000687416421548792, // Level 3
0.000343708210774396, // Level 4
0.000171854105387198,
8.5927052693599E-05,
4.29635263467995E-05,
2.14817631733998E-05,
1.07408815866999E-05,
5.37044079334994E-06,
2.68522039667497E-06,
1.34261019833748E-06
];
var crs = new L.Proj.CRS('EPSG:4490',
'+proj=longlat +ellps=GRS80 +no_defs',
{
resolutions: res,
origin: [118.122911693886, 31.2869311022836],
}
);
var map = L.map('mapid', {
crs: crs
});
var url = "http://1.1.1.1:8080/68DE38F71E38CD8C508FAB3035752EA8ED8F9221EDE18FDBE593B01FCDD12BD296F09FE27CD7D2733AD075EAF994851B/PBS/rest/services/hzsyraster/Mapserver";
var attrib = "© 杭州市规划资源局";
var basemap = new L.TileLayer(url + "/tile/{z}/{y}/{x}", {
tileSize: 256,
attribution: attrib
});
map.addLayer(basemap);
map.setView([30, 120], 4); //设置比例尺和中心点级别
\</script>
\</body>
\</html>3.3.1.3手动加载/移除地图
3.3.2图层
3.3.2.1弹出信息框
点击地图弹出信息,示例代码bindPopup
\<html>
\<head>
\<meta charset="UTF-8">
\<title>添加电子地图\</title>
<!--添加leaflet样式-->
\<link rel="stylesheet" href="http://1.1.1.1:8082/leaflet/V1.3/leaflet/leaflet.css" />
<!--添加leafletjs包-->
\<script src="http://1.1.1.1:8082/leaflet/V1.3/leaflet/leaflet.js">\</script>
<!--添加坐标库-->
\<script src="http://1.1.1.1:8082/leaflet/V1.3/pro/proj4-compressed.js">\</script>
\<script src="http://1.1.1.1:8082/leaflet/V1.3/pro/proj4leaflet.js">\</script>
\<style>
html {
height: 100%
}
body {
height: 100%;
margin: 0;
padding: 0;
}
.map {
height: 100%
}
\</style>
\</head>
\<body>
\<div id="mapid" class="map">\</div>
\<script>
var res = [
0.00549933137239034, // Level 0
0.00274966568619517, // Level 1
0.00137483284309758, // Level 2
0.000687416421548792, // Level 3
0.000343708210774396, // Level 4
0.000171854105387198,
8.5927052693599E-05,
4.29635263467995E-05,
2.14817631733998E-05,
1.07408815866999E-05,
5.37044079334994E-06,
2.68522039667497E-06,
1.34261019833748E-06
];
var crs = new L.Proj.CRS('EPSG:4490',
'+proj=longlat +ellps=GRS80 +no_defs',
{
resolutions: res,
origin: [118.122911693886, 31.2869311022836], //切图原点
}
);
var map = L.map('mapid', {
crs: crs
});
var url = "http://1.1.1.1:8080/68DE38F71E38CD8C508FAB3035752EA8ED8F9221EDE18FDBE593B01FCDD12BD296F09FE27CD7D2733AD075EAF994851B/PBS/rest/services/hzsyvector/Mapserver";
var attrib = "© 杭州市规划资源局";
var basemap = new L.TileLayer(url + "/tile/{z}/{y}/{x}", {
tileSize: 256,
attribution: attrib
});
map.addLayer(basemap);
map.setView([30.25168, 120.16179], 4); //设置比例尺和中心点级别
L.marker([30.25168, 120.16179]).addTo(map).bindPopup("\<b>Hello world!\</b>\<br />I am a popup.").openPopup();
\</script>
\</body>
\</html>3.3.2.2矢量图层(wms)
加载WMS地图服务,支持filter筛选
\<!DOCTYPE html>
\<html>
\<head>
\<meta charset="UTF-8">
\<title>调用WMS\</title>
\<link rel="stylesheet" href="http://1.1.1.1:8082/leaflet/V1.3/leaflet/leaflet.css" />
\<script src="http://1.1.1.1:8082/leaflet/V1.3/leaflet/leaflet.js">\</script>
\<script src="http://1.1.1.1:8082/leaflet/V1.3/leaflet/Plugins/leaflet.wms.js">\</script>
\<script src="http://1.1.1.1:8082/leaflet/V1.3/pro/proj4-compressed.js">\</script>
\<script src="http://1.1.1.1:8082/leaflet/V1.3/pro/proj4leaflet.js">\</script>
\<style>
html {
height: 100%
}
body {
height: 100%;
margin: 0;
padding: 0;
}
.map {
height: 100%
}
\</style>
\</head>
\<body>
\<div id="mapid" class="map">\</div>
\<script>
var res = [
0.00549933137239034, // Level 0
0.00274966568619517, // Level 1
0.00137483284309758, // Level 2
0.000687416421548792, // Level 3
0.000343708210774396, // Level 4
0.000171854105387198,
8.5927052693599E-05,
4.29635263467995E-05,
2.14817631733998E-05,
1.07408815866999E-05,
5.37044079334994E-06,
2.68522039667497E-06,
1.34261019833748E-06
];
var crs = new L.Proj.CRS('EPSG:4490',
'+proj=longlat +ellps=GRS80 +no_defs',
{
resolutions: res,
origin: [118.122911693886, 31.2869311022836],
}
);
var map = L.map('mapid', {
crs: crs
});
var url = "http://1.1.1.1:8080/68DE38F71E38CD8C508FAB3035752EA8ED8F9221EDE18FDBE593B01FCDD12BD296F09FE27CD7D2733AD075EAF994851B/PBS/rest/services/hzsyvector/Mapserver";
var attrib = "© 杭州市规划资源局";
var basemap = new L.TileLayer(url + "/tile/{z}/{y}/{x}", {
tileSize: 256,
attribution: attrib
});
map.addLayer(basemap);
map.setView([30, 120], 4); //设置比例尺和中心点级别
// L.WMS.source
var wmsurl = L.WMS.overlay("http://1.1.1.1:8080/68DE38F71E38CD8C508FAB3035752EA8ED8F9221EDE18FDBE593B01FCDD12BD296F09FE27CD7D2733AD075EAF994851B/PBS/rest/services/lsyt_dmdz_csbj0619/MapServer/wms",
{
"transparent": true,
"srs": "EPSG:4490",
"layers": "lsyt_dmdz_csbj0619",
"format": "image/png",
"CQL_FILTER": "quxian='余杭区'"
});
map.addLayer(wmsurl);
map.on('click', function (e) {
alert("You clicked the map at " + e.latlng);
});
\</script>
\</body>
\</html>3.3.2.3矢量图层(wfs)
\<!DOCTYPE html>
\<html>
\<head>
\<meta charset="UTF-8" />
\<title>加载WFS电子地图\</title>
\<link rel="stylesheet" href="http://1.1.1.1:8082/leaflet/V1.3/leaflet/leaflet.css" />
\<script src="http://1.1.1.1:8082/leaflet/V1.3/leaflet/leaflet.js">\</script>
\<script src="http://1.1.1.1:8082/leaflet/V1.3/leaflet/Plugins/leaflet-wfs.js">\</script>
\<script src="http://1.1.1.1:8082/leaflet/V1.3/pro/proj4-compressed.js">\</script>
\<script src="http://1.1.1.1:8082/leaflet/V1.3/pro/proj4leaflet.js">\</script>
\<script src="http://1.1.1.1:8082/jquery/jquery.js">\</script>
\<style>
html {
height: 100%;
}
body {
height: 100%;
margin: 0;
padding: 0;
}
.map {
height: 100%;
}
\</style>
\</head>
\<body>
\<div id="mapid" class="map">\</div>
\<script>
var res = [
0.00549933137239034, // Level 0
0.00274966568619517, // Level 1
0.00137483284309758, // Level 2
0.000687416421548792, // Level 3
0.000343708210774396, // Level 4
0.000171854105387198,
8.5927052693599e-5,
4.29635263467995e-5,
2.14817631733998e-5,
1.07408815866999e-5,
5.37044079334994e-6,
2.68522039667497e-6,
1.34261019833748e-6,
];
var crs = new L.Proj.CRS(
"EPSG:4490",
"+proj=longlat +ellps=GRS80 +no_defs",
{
resolutions: res,
origin: [118.122911693886, 31.2869311022836],
}
);
var map = L.map("mapid", {
crs: crs,
});
var url =
"http://1.1.1.1:8080/68DE38F71E38CD8C508FAB3035752EA8ED8F9221EDE18FDBE593B01FCDD12BD296F09FE27CD7D2733AD075EAF994851B/PBS/rest/services/hzsyvector/Mapserver";
var attrib = "© 杭州市规划资源局";
var basemap = new L.TileLayer(url + "/tile/{z}/{y}/{x}", {
tileSize: 256,
attribution: attrib,
});
map.addLayer(basemap);
map.setView([30, 120], 4); //设置比例尺和中心点级别
map.on("click", function (e) {
alert("You clicked the map at " + e.latlng);
});
var myStyle = {
color: "#ff0000",
weight: 2,
opacity: 1,
fillOpacity: 0.01,
};
var mblayer;
$.ajax({
url:
"http://1.1.1.1:8080/68DE38F71E38CD8C508FAB3035752EA8ED8F9221EDE18FDBE593B01FCDD12BD296F09FE27CD7D2733AD075EAF994851B/PBS/rest/services/lsyt_dmdz_qxbj0619/MapServer/wfs?service=wfs&version=1.0.0&request=getfeature&typename=lsyt_dmdz_qxbj0619&outputFormat=application/json",
success: function (data) {
var geojson = JSON.parse(data);
mblayer = L.geoJSON(geojson, {
style: myStyle,
}).addTo(map);
},
});
\</script>
\</body>
\</html>3.3.2.4 图片图层
    let gjyjstgy = esri.dynamicMapLayer({
      url: "http://1.1.1.1:6080/arcgis/rest/services/DGRH/MapServer",
      layers: [4],
    });

    self.gjyjstgylGroup = L.layerGroup([gjyjstgy]);

    var overlayMaps = {
      行政界限: layer,
      国家一级生态公益林: self.gjyjstgylGroup,
    };

    self.map.addLayer(layer);
 	L.control.layers(baseMaps, overlayMaps).addTo(self.map);
3.3.2.5图层控制
    var basemap1 = new L.TileLayer( //    hzsyvector_dark
      "http://1.1.1.1:8887/740D333CAD2D0DD9786474D39D072E3364077B08F2ED472F7FAF0322F549E4CBE1C70DDF272573B6DD48875FF21CD703/PBS/rest/services/202112cavector/Mapserver/tile/{z}/{y}/{x}",
      //this.mapYxUrl+"/tile/{z}/{y}/{x}",
      {
        tileSize: 256,
        minZoom: 0,
        maxZoom: 12,
      }
    );
    let gjyjstgy = esri.dynamicMapLayer({
      url: "http://10.33.237.149:6080/arcgis/rest/services/DGRH/MapServer",
      layers: [4],
    });

    self.gjyjstgylGroup = L.layerGroup([gjyjstgy]);

    var overlayMaps = {
      行政界限: layer,
      国家一级生态公益林: self.gjyjstgylGroup,
    };
    var baseMaps = {
      电子地图: basemap1,
      影像地图: basemap,
    };

    L.control.layers(baseMaps, overlayMaps).addTo(self.map);
3.3.3查询
3.3.3.1点查询
\<!DOCTYPE html>
\<html>
\<head>
\<meta charset="UTF-8" />
\<title>点查询\</title>
\<link rel="stylesheet" href="http://1.1.1.1:8082/leaflet/V1.3/leaflet/leaflet.css" />
\<script src="http://1.1.1.1:8082/leaflet/V1.3/leaflet/leaflet.js">\</script>
\<script src="http://1.1.1.1:8082/leaflet/V1.3/leaflet/Plugins/leaflet-wfs.js">\</script>
\<script src="http://1.1.1.1:8082/leaflet/V1.3/pro/proj4-compressed.js">\</script>
\<script src="http://1.1.1.1:8082/leaflet/V1.3/pro/proj4leaflet.js">\</script>
\<script src="http://1.1.1.1:8082/jquery/jquery.js">\</script>
\<style>
html {
height: 100%;
}
body {
height: 100%;
margin: 0;
padding: 0;
}
.map {
height: 100%;
}
\</style>
\</head>
\<body>
\<div id="mapid" class="map">\</div>
\<script>
var res = [
0.00549933137239034, // Level 0
0.00274966568619517, // Level 1
0.00137483284309758, // Level 2
0.000687416421548792, // Level 3
0.000343708210774396, // Level 4
0.000171854105387198,
8.5927052693599e-5,
4.29635263467995e-5,
2.14817631733998e-5,
1.07408815866999e-5,
5.37044079334994e-6,
2.68522039667497e-6,
1.34261019833748e-6,
];
var crs = new L.Proj.CRS(
"EPSG:4490",
"+proj=longlat +ellps=GRS80 +no_defs",
{
resolutions: res,
origin: [118.122911693886, 31.2869311022836],
}
);
var map = L.map("mapid", {
crs: crs,
/*fullscreenControl: {
pseudoFullscreen: false
},*/
});
var url =
"http://1.1.1.1:8080/68DE38F71E38CD8C508FAB3035752EA8ED8F9221EDE18FDBE593B01FCDD12BD296F09FE27CD7D2733AD075EAF994851B/PBS/rest/services/hzsyvector/Mapserver";
var attrib = "© 杭州市规划资源局";
var basemap = new L.TileLayer(url + "/tile/{z}/{y}/{x}", {
tileSize: 256,
attribution: attrib,
});
map.addLayer(basemap);
map.setView([30, 120], 4); //设置比例尺和中心点级别
map.on("click", function (e) {
// alert("You clicked the map at " + e.latlng);
var point = e.latlng.lng + "," + e.latlng.lat + "," + e.latlng.lng + "," + e.latlng.lat;// "120.16271670916996,30.251675868508478,120.1713094144393,30.25591314629446";
var qurl =
"http://1.1.1.1:8080/68DE38F71E38CD8C508FAB3035752EA8ED8F9221EDE18FDBE593B01FCDD12BD296F09FE27CD7D2733AD075EAF994851B/PBS/rest/services/lsyt_dmdz_qxbj0619/MapServer/wfs?service=wfs&version=1.0.0&request=getfeature&typename=lsyt_dmdz_qxbj0619&outputFormat=application/json&CQL_FILTER=BBOX(geom," + point + ")";
$.ajax({
url: qurl,
success: function (data) {
console.log(data);
var text = JSON.parse(data);
alert("You clicked the map at " + text.features[1].properties['quxian']);
}
});
});
var myStyle = {
color: "#ff0000",
weight: 2,
opacity: 1,
fillOpacity: 0.01,
};
var mblayer;
$.ajax({
url:
"http://1.1.1.1:8080/68DE38F71E38CD8C508FAB3035752EA8ED8F9221EDE18FDBE593B01FCDD12BD296F09FE27CD7D2733AD075EAF994851B/PBS/rest/services/lsyt_dmdz_qxbj0619/MapServer/wfs?service=wfs&version=1.0.0&request=getfeature&typename=lsyt_dmdz_qxbj0619&outputFormat=application/json",
success: function (data) {
var geojson = JSON.parse(data);
mblayer = L.geoJSON(geojson, {
style: myStyle,
}).addTo(map);
},
});
\</script>
\</body>
\</html>3.3.3.2面查询
\<!DOCTYPE html>
\<html>
\<head>
\<meta charset="UTF-8" />
\<title>面查询\</title>
\<link rel="stylesheet" href="http://1.1.1.1:8082/leaflet/V1.3/leaflet/leaflet.css" />
\<link rel="stylesheet" href="http://1.1.1.1:8082/leaflet/V1.3/leaflet/Plugins/leaflet-draw/leaflet.draw.css" />
\<script src="http://1.1.1.1:8082/leaflet/V1.3/leaflet/leaflet.js">\</script>
\<script src="http://1.1.1.1:8082/leaflet/V1.3/leaflet/Plugins/leaflet-wfs.js">\</script>
\<script src="http://1.1.1.1:8082/leaflet/V1.3/pro/proj4-compressed.js">\</script>
\<script src="http://1.1.1.1:8082/leaflet/V1.3/pro/proj4leaflet.js">\</script>
\<script src="http://1.1.1.1:8082/jquery/jquery.js">\</script>
\<script src="http://1.1.1.1:8082/leaflet/V1.3/leaflet/Plugins/leaflet-draw/leaflet.draw.js">\</script>
\<style>
html {
height: 100%;
}
body {
height: 100%;
margin: 0;
padding: 0;
}
.map {
height: 100%;
}
\</style>
\</head>
\<body>
\<div id="mapid" class="map">\</div>
\<script>
var res = [
0.00549933137239034, // Level 0
0.00274966568619517, // Level 1
0.00137483284309758, // Level 2
0.000687416421548792, // Level 3
0.000343708210774396, // Level 4
0.000171854105387198,
8.5927052693599e-5,
4.29635263467995e-5,
2.14817631733998e-5,
1.07408815866999e-5,
5.37044079334994e-6,
2.68522039667497e-6,
1.34261019833748e-6,
];
var crs = new L.Proj.CRS(
"EPSG:4490",
"+proj=longlat +ellps=GRS80 +no_defs",
{
resolutions: res,
origin: [118.122911693886, 31.2869311022836],
}
);
var map = L.map("mapid", {
crs: crs,
/*fullscreenControl: {
pseudoFullscreen: false
},*/
});
var url =
"http://1.1.1.1:8080/68DE38F71E38CD8C508FAB3035752EA8ED8F9221EDE18FDBE593B01FCDD12BD296F09FE27CD7D2733AD075EAF994851B/PBS/rest/services/hzsyvector/Mapserver";
var attrib = "© 杭州市规划资源局";
var basemap = new L.TileLayer(url + "/tile/{z}/{y}/{x}", {
tileSize: 256,
attribution: attrib,
});
map.addLayer(basemap);
map.setView([30, 120], 4); //设置比例尺和中心点级别
//var draw=new L.Control.Draw(map,drawControl.options.rectangle).enable();
var options = {
position: "topleft",
draw: {
polyline: false,
polygon: false,
circle: false,
marker: false,
circlemarker: false,
rectangle: {
shapeOptions: {
clickable: true,
},
},
},
};
var drawControl = new L.Control.Draw(options);
map.addControl(drawControl);
map.on(L.Draw.Event.CREATED, function (e) {
var type = e.layerType;
if (type == "rectangle") {
var bound = e.layer.getBounds();
var point =
bound._southWest.lng +
"," +
bound._southWest.lat +
"," +
bound._northEast.lng +
"," +
bound._northEast.lat; // "120.16271670916996,30.251675868508478,120.1713094144393,30.25591314629446";
var qurl =
"http://1.1.1.1:8080/68DE38F71E38CD8C508FAB3035752EA8ED8F9221EDE18FDBE593B01FCDD12BD296F09FE27CD7D2733AD075EAF994851B/PBS/rest/services/lsyt_dmdz_qxbj0619/MapServer/wfs?service=wfs&version=1.0.0&request=getfeature&typename=lsyt_dmdz_qxbj0619&outputFormat=application/json&CQL_FILTER=BBOX(geom," +
point +
")";
$.ajax({
url: qurl,
success: function (data) {
console.log(data);
var text = JSON.parse(data);
alert(
"你选择的是 " + text.features[1].properties["quxian"]
);
},
});
}
});
var myStyle = {
color: "#ff0000",
weight: 2,
opacity: 1,
fillOpacity: 0.01,
};
var mblayer;
$.ajax({
url:
"http://1.1.1.1:8080/68DE38F71E38CD8C508FAB3035752EA8ED8F9221EDE18FDBE593B01FCDD12BD296F09FE27CD7D2733AD075EAF994851B/PBS/rest/services/lsyt_dmdz_qxbj0619/MapServer/wfs?service=wfs&version=1.0.0&request=getfeature&typename=lsyt_dmdz_qxbj0619&outputFormat=application/json",
success: function (data) {
var geojson = JSON.parse(data);
mblayer = L.geoJSON(geojson, {
style: myStyle,
}).addTo(map);
},
});
\</script>
\</body>
\</html>3.3.3.3属性查询
\<!DOCTYPE html>
\<html>
\<head>
\<meta charset="UTF-8" />
\<title>点查询\</title>
\<link rel="stylesheet" href="http://1.1.1.1:8082/leaflet/V1.3/leaflet/leaflet.css" />
\<script src="http://1.1.1.1:8082/leaflet/V1.3/leaflet/leaflet.js">\</script>
\<script src="http://1.1.1.1:8082/leaflet/V1.3/leaflet/Plugins/leaflet-wfs.js">\</script>
\<script src="http://1.1.1.1:8082/leaflet/V1.3/pro/proj4-compressed.js">\</script>
\<script src="http://1.1.1.1:8082/leaflet/V1.3/pro/proj4leaflet.js">\</script>
\<script src="http://1.1.1.1:8082/jquery/jquery.js">\</script>
\<style>
html {
height: 100%;
}
body {
height: 100%;
margin: 0;
padding: 0;
}
.map {
height: 100%;
}
.h1 {
z-index: 1009;
position: absolute;
left: 100px;
}
\</style>
\</head>
\<body>
\<div id="mapid" class="map">
\<h1>点击地图根据属性查询\</h1>
\</div>
\<script>
var res = [
0.00549933137239034, // Level 0
0.00274966568619517, // Level 1
0.00137483284309758, // Level 2
0.000687416421548792, // Level 3
0.000343708210774396, // Level 4
0.000171854105387198,
8.5927052693599e-5,
4.29635263467995e-5,
2.14817631733998e-5,
1.07408815866999e-5,
5.37044079334994e-6,
2.68522039667497e-6,
1.34261019833748e-6,
];
var crs = new L.Proj.CRS(
"EPSG:4490",
"+proj=longlat +ellps=GRS80 +no_defs",
{
resolutions: res,
origin: [118.122911693886, 31.2869311022836],
}
);
var map = L.map("mapid", {
crs: crs,
/*fullscreenControl: {
pseudoFullscreen: false
},*/
});
var url =
"http://1.1.1.1:8080/68DE38F71E38CD8C508FAB3035752EA8ED8F9221EDE18FDBE593B01FCDD12BD296F09FE27CD7D2733AD075EAF994851B/PBS/rest/services/hzsyvector/Mapserver";
var attrib = "© 杭州市规划资源局";
var basemap = new L.TileLayer(url + "/tile/{z}/{y}/{x}", {
tileSize: 256,
attribution: attrib,
});
map.addLayer(basemap);
map.setView([30, 120], 4); //设置比例尺和中心点级别
map.on("click", function (e) {
var point =
e.latlng.lng +
"," +
e.latlng.lat +
"," +
e.latlng.lng +
"," +
e.latlng.lat; // "120.16271670916996,30.251675868508478,120.1713094144393,30.25591314629446";
var qurl =
"http://1.1.1.1:8080/68DE38F71E38CD8C508FAB3035752EA8ED8F9221EDE18FDBE593B01FCDD12BD296F09FE27CD7D2733AD075EAF994851B/PBS/rest/services/lsyt_dmdz_qxbj0619/MapServer/wfs?service=wfs&version=1.0.0&request=getfeature&typename=lsyt_dmdz_qxbj0619&outputFormat=application/json&CQL_FILTER=";
qurl += " quxian='上城区'";
$.ajax({
url: qurl,
success: function (data) {
console.log(data);
var text = JSON.parse(data);
alert("根据属性选择的是 " + text.features[0].properties["quxian"]);
},
});
});
var myStyle = {
color: "#ff0000",
weight: 2,
opacity: 1,
fillOpacity: 0.01,
};
var mblayer;
$.ajax({
url:
"http://1.1.1.1:8080/68DE38F71E38CD8C508FAB3035752EA8ED8F9221EDE18FDBE593B01FCDD12BD296F09FE27CD7D2733AD075EAF994851B/PBS/rest/services/lsyt_dmdz_qxbj0619/MapServer/wfs?service=wfs&version=1.0.0&request=getfeature&typename=lsyt_dmdz_qxbj0619&outputFormat=application/json",
success: function (data) {
var geojson = JSON.parse(data);
mblayer = L.geoJSON(geojson, {
style: myStyle,
}).addTo(map);
},
});
\</script>
\</body>
\</html>3.3.3.4组合查询
\<!DOCTYPE html>
\<html>
\<head>
\<meta charset="UTF-8" />
\<title>面查询\</title>
\<link rel="stylesheet" href="http://1.1.1.1:8082/leaflet/V1.3/leaflet/leaflet.css" />
\<link rel="stylesheet" href="http://1.1.1.1:8082/leaflet/V1.3/leaflet/Plugins/leaflet-draw/leaflet.draw.css" />
\<script src="http://1.1.1.1:8082/leaflet/V1.3/leaflet/leaflet.js">\</script>
\<script src="http://1.1.1.1:8082/leaflet/V1.3/leaflet/Plugins/leaflet-wfs.js">\</script>
\<script src="http://1.1.1.1:8082/leaflet/V1.3/pro/proj4-compressed.js">\</script>
\<script src="http://1.1.1.1:8082/leaflet/V1.3/pro/proj4leaflet.js">\</script>
\<script src="http://1.1.1.1:8082/jquery/jquery.js">\</script>
\<script src="http://1.1.1.1:8082/leaflet/V1.3/leaflet/Plugins/leaflet-draw/leaflet.draw.js">\</script>
\<style>
html {
height: 100%;
}
body {
height: 100%;
margin: 0;
padding: 0;
}
.map {
height: 100%;
}
\</style>
\</head>
\<body>
\<div id="mapid" class="map">\</div>
\<script>
var res = [
0.00549933137239034, // Level 0
0.00274966568619517, // Level 1
0.00137483284309758, // Level 2
0.000687416421548792, // Level 3
0.000343708210774396, // Level 4
0.000171854105387198,
8.5927052693599e-5,
4.29635263467995e-5,
2.14817631733998e-5,
1.07408815866999e-5,
5.37044079334994e-6,
2.68522039667497e-6,
1.34261019833748e-6,
];
var crs = new L.Proj.CRS(
"EPSG:4490",
"+proj=longlat +ellps=GRS80 +no_defs",
{
resolutions: res,
origin: [118.122911693886, 31.2869311022836],
}
);
var map = L.map("mapid", {
crs: crs,
/*fullscreenControl: {
pseudoFullscreen: false
},*/
});
var url =
"http://1.1.1.1:8080/68DE38F71E38CD8C508FAB3035752EA8ED8F9221EDE18FDBE593B01FCDD12BD296F09FE27CD7D2733AD075EAF994851B/PBS/rest/services/hzsyvector/Mapserver";
var attrib = "© 杭州市规划资源局";
var basemap = new L.TileLayer(url + "/tile/{z}/{y}/{x}", {
tileSize: 256,
attribution: attrib,
});
map.addLayer(basemap);
map.setView([30, 120], 4); //设置比例尺和中心点级别
//var draw=new L.Control.Draw(map,drawControl.options.rectangle).enable();
var options = {
position: "topleft",
draw: {
polyline: false,
polygon: false,
circle: false,
marker: false,
circlemarker: false,
rectangle: {
shapeOptions: {
clickable: true,
},
},
},
};
var drawControl = new L.Control.Draw(options);
map.addControl(drawControl);
map.on(L.Draw.Event.CREATED, function (e) {
var type = e.layerType;
if (type == "rectangle") {
var bound = e.layer.getBounds();
var point =
bound._southWest.lng +
"," +
bound._southWest.lat +
"," +
bound._northEast.lng +
"," +
bound._northEast.lat; // "120.16271670916996,30.251675868508478,120.1713094144393,30.25591314629446";
var qurl =
"http://1.1.1.1:8080/68DE38F71E38CD8C508FAB3035752EA8ED8F9221EDE18FDBE593B01FCDD12BD296F09FE27CD7D2733AD075EAF994851B/PBS/rest/services/lsyt_dmdz_qxbj0619/MapServer/wfs?service=wfs&version=1.0.0&request=getfeature&typename=lsyt_dmdz_qxbj0619&outputFormat=application/json&CQL_FILTER=BBOX(geom," +
point +
")";
qurl += " and quxian='上城区'";
$.ajax({
url: qurl,
success: function (data) {
console.log(data);
var text = JSON.parse(data);
if (!text.features.length) {
alert("你选择的是非上城区,无查询结果!");
} else {
alert("你选择的是 " + text.features[0].properties["quxian"]);
}
},
});
}
});
var myStyle = {
color: "#ff0000",
weight: 2,
opacity: 1,
fillOpacity: 0.01,
};
var mblayer;
$.ajax({
url:
"http://1.1.1.1:8080/68DE38F71E38CD8C508FAB3035752EA8ED8F9221EDE18FDBE593B01FCDD12BD296F09FE27CD7D2733AD075EAF994851B/PBS/rest/services/lsyt_dmdz_qxbj0619/MapServer/wfs?service=wfs&version=1.0.0&request=getfeature&typename=lsyt_dmdz_qxbj0619&outputFormat=application/json",
success: function (data) {
var geojson = JSON.parse(data);
mblayer = L.geoJSON(geojson, {
style: myStyle,
}).addTo(map);
},
});
\</script>
\</body>
\</html>3.3.4 Esri Leaflet
3.3.5弹框
showPoupo(polygon) {
      polygon.on("click", function (e) {
        console.log("点击坐标:", e.latlng);
        console.log("点击了polygon", polygon);
        console.log("点击了polygon.projectId", polygon.options.projectId);
        var latlngs = polygon._latlngs;
        let html = "";
        let query = {
          projectId: polygon.options.projectId,
        };
        listWithProject(query).then((res) => {
          console.log("查询结果", res);
          let property = res.rows[0];
          console.log("基础属性查询结果", property);
          let transition = {
            createTime: "创建时间",
            mph: "门牌号",
            zu: "组",
            cun: "村",
            xz: "乡镇",
            xzq: "区",
            city: "市",
            province: "省",
            xmbh: "项目编号",
            projectId: " 项目ID",
            attributeId: "属性ID",
            administerEndTime: "核查结束时间",
            checkEndTime: "整改结束时间",
            projectStep: "项目阶段",
          };
          for (const key in property) {
            if (
              property[key] != null &&
              transition[key] != null &&
              !(property[key] instanceof Object)
            ) {
              let value = property[key];

              html = html + transition[key] + ":" + value + "<br>";
            }
          }
          polygon.bindPopup(html).openPopup();
        });
      });
    },
3.3.6 定位
    localtion(projectId) {
      if (this.localtionPolygon) {
        this.map.removeLayer(this.localtionPolygon);
      }
      let query = {
        projectId: projectId,
      };
      listMap(query).then((response) => {
        console.log("查询结果", response);
        response.rows = this.revert(response.rows);
        response.rows.forEach((item) => {
          this.localtionPolygon = L.polygon(item.mapPolygon[0], {
            color: "black",
          }).addTo(this.map);
          this.showPoupo(this.localtionPolygon);
          this.map.fitBounds(this.localtionPolygon.getBounds());
        });
      });
    },
3.3.7 坐标经纬度调换
    revert(polygons) {
      polygons.forEach((item) => {
        console.log(" item.mapPolygon", item.mapPolygon);
        let polygonArray = JSON.parse(item.mapPolygon);
        for (let i = 0; i < polygonArray.length; i++) {
          let coor = polygonArray[i];
          polygonArray[i] = coor.map((mapitem) => {
            return [mapitem[1], mapitem[0]];
          });
        }
        item.mapPolygon = polygonArray;
      });

      console.log("转换后地图数据", polygons);
      return polygons;
    },
   revert(rings) {
      return rings.map((ring) => ring.map((point) => [point[1], point[0]]));
    },
3.3.8 VUE使用
常用依赖
//引入样式文件
import 'leaflet/dist/leaflet.css'
//引入Leaflet对象 挂载到Vue上,便于全局使用,也可以单独页面中单独引用
import * as L from 'leaflet'
Vue.L = Vue.prototype.$L = L;
import "proj4leaflet";
var esri = require("esri-leaflet");


//引用esri-leaflet
let esri = require("esri-leaflet");
import proj4 from 'proj4';
window.proj4 = proj4; // 用于leaflet切片
import 'leaflet.chinatmsproviders' // 用于leaflet   引用天地图
不同类型数据加载
ArcGIS
ArcGIS API for JavaScript就是ESRI公司用JavaScipt语言编写的一套程序接口。用户可以通过调用API获取ArcGIS server、geoserver等提供的服务,例如浏览、编辑、渲染地图,以及一些常用的空间分析功能。API中包含了ArcGIS API for JavaScript中每个类的详细描述。使用API查找每个类的构造函数选项以及属性、方法和事件。
详情见官方网站https://developers.arcgis.com/javascript/3/jsapi/
3.1.1地图
3.1.1.1矢量电子地图
\<!DOCTYPE html>
\<html>
\<head>
\<meta http-equiv="Content-Type" content="text/html; charset=utf-8" />
\<meta name="viewport" content="initial-scale=1, maximum-scale=1,user-scalable=no" />
\<title>Map with Vertor\</title>
\<link rel="stylesheet" href="http://1.1.1.1:8082/arcgis_js_api/3.24/dijit/themes/claro/claro.css" />
\<link rel="stylesheet" href="http://1.1.1.1:8082/arcgis_js_api/3.24/esri/css/esri.css" />
\<style>
html,
body,
\#map {
height: 100%;
width: 100%;
margin: 0;
padding: 0;
}
.esriControlsBR .logo-med {
display: none;
}
\</style>
\<script src="http://1.1.1.1:8082/arcgis_js_api/3.24/init.js">\</script>
\<script src="http://1.1.1.1:8082/jquery/jquery.js">\</script>
\<script>
var map;
require([
"esri/map",
"esri/layers/WMSLayer",
"esri/layers/WMSLayerInfo",
"esri/layers/ArcGISTiledMapServiceLayer",
"esri/geometry/Extent",
"dojo/_base/array",
"dojo/dom",
"dojo/dom-construct",
"dojo/parser",
"dijit/layout/BorderContainer",
"dijit/layout/ContentPane",
"dojo/domReady!",
], function (
Map,
WMSLayer,
WMSLayerInfo,
ArcGISTiledMapServiceLayer,
Extent,
array,
dom,
domConst,
parser
) {
parser.parse();
map = new Map("map", {
center: new esri.geometry.Point(
120.1594,
30.2571,
new esri.SpatialReference({ wkid: 4490 })
),
zoom: 3,
});
var layer = new ArcGISTiledMapServiceLayer(
"http://1.1.1.1:8080/68DE38F71E38CD8C508FAB3035752EA8ED8F9221EDE18FDBE593B01FCDD12BD296F09FE27CD7D2733AD075EAF994851B/PBS/rest/services/hzsyvector/Mapserver",
{
id: "vector",
}
);
map.addLayer(layer);
});
\</script>
\</head>
\<body class="claro">
\<div id="map" data-dojo-type="dijit.layout.ContentPane" data-dojo-props="region:'center'"
style="overflow: hidden;" \>\</div>
\</div>
\</body>
\</html>3.1.1.2影像电子地图
\<!DOCTYPE html>
\<html>
\<head>
\<meta http-equiv="Content-Type" content="text/html; charset=utf-8" />
\<meta name="viewport" content="initial-scale=1, maximum-scale=1,user-scalable=no" />
\<title>Map with Raster\</title>
\<link rel="stylesheet" href="http://1.1.1.1:8082/arcgis_js_api/3.24/dijit/themes/claro/claro.css" />
\<link rel="stylesheet" href="http://1.1.1.1:8082/arcgis_js_api/3.24/esri/css/esri.css" />
\<style>
html,
body,
\#map {
height: 100%;
width: 100%;
margin: 0;
padding: 0;
}
.esriControlsBR .logo-med {
display: none;
}
\</style>
\<script src="http://1.1.1.1:8082/arcgis_js_api/3.24/init.js">\</script>
\<script src="http://1.1.1.1:8082/jquery/jquery.js">\</script>
\<script>
var map;
require([
"esri/map",
"esri/layers/WMSLayer",
"esri/layers/WMSLayerInfo",
"esri/layers/ArcGISTiledMapServiceLayer",
"esri/geometry/Extent",
"dojo/_base/array",
"dojo/dom",
"dojo/dom-construct",
"dojo/parser",
"dijit/layout/BorderContainer",
"dijit/layout/ContentPane",
"dojo/domReady!",
], function (
Map,
WMSLayer,
WMSLayerInfo,
ArcGISTiledMapServiceLayer,
Extent,
array,
dom,
domConst,
parser
) {
parser.parse();
map = new Map("map", {
center: new esri.geometry.Point(
120.1594,
30.2571,
new esri.SpatialReference({ wkid: 4490 })
),
zoom: 3,
});
var layer = new ArcGISTiledMapServiceLayer(
"http://1.1.1.1:8080/68DE38F71E38CD8C508FAB3035752EA8ED8F9221EDE18FDBE593B01FCDD12BD296F09FE27CD7D2733AD075EAF994851B/PBS/rest/services/hzsyraster/Mapserver",
{
id: "raster",
}
);
map.addLayer(layer);
});
\</script>
\</head>
\<body class="claro">
\<div id="map" data-dojo-type="dijit.layout.ContentPane" data-dojo-props="region:'center'"
style="overflow: hidden;" \>\</div>
\</div>
\</body>
\</html>3.1.1.3手动加载/移除地图
\<!DOCTYPE html>
\<html>
\<head>
\<meta http-equiv="Content-Type" content="text/html; charset=utf-8" />
\<meta name="viewport" content="initial-scale=1, maximum-scale=1,user-scalable=no" />
\<title>Map with Control\</title>
\<link rel="stylesheet" href="http://1.1.1.1:8082/arcgis_js_api/3.24/dijit/themes/claro/claro.css" />
\<link rel="stylesheet" href="http://1.1.1.1:8082/arcgis_js_api/3.24/esri/css/esri.css" />
\<style>
html,
body,
\#map {
height: 100%;
width: 100%;
margin: 0;
padding: 0;
}
.esriControlsBR .logo-med {
display: none;
}
.details span {
cursor: pointer;
}
\</style>
\<script src="http://1.1.1.1:8082/arcgis_js_api/3.24/init.js">\</script>
\<script src="http://1.1.1.1:8082/jquery/jquery.js">\</script>
\<script>
var map;
require([
"esri/map",
"esri/layers/WMSLayer",
"esri/layers/WMSLayerInfo",
"esri/layers/ArcGISTiledMapServiceLayer",
"esri/geometry/Extent",
"dojo/_base/array",
"dojo/dom",
"dojo/dom-construct",
"dojo/parser",
"dijit/layout/BorderContainer",
"dijit/layout/ContentPane",
"dojo/domReady!",
], function (
Map,
WMSLayer,
WMSLayerInfo,
ArcGISTiledMapServiceLayer,
Extent,
array,
dom,
domConst,
parser
) {
parser.parse();
map = new Map("map", {
center: new esri.geometry.Point(
120.1594,
30.2571,
new esri.SpatialReference({ wkid: 4490 })
),
zoom: 3,
});
var vector = new ArcGISTiledMapServiceLayer(
"http://1.1.1.1:8080/68DE38F71E38CD8C508FAB3035752EA8ED8F9221EDE18FDBE593B01FCDD12BD296F09FE27CD7D2733AD075EAF994851B/PBS/rest/services/hzsyvector/Mapserver",
{
id: "vector",
}
);
// map.addLayer(vector);
var raster = new ArcGISTiledMapServiceLayer(
"http://1.1.1.1:8080/68DE38F71E38CD8C508FAB3035752EA8ED8F9221EDE18FDBE593B01FCDD12BD296F09FE27CD7D2733AD075EAF994851B/PBS/rest/services/hzsyraster/Mapserver",
{
id: "raster",
}
);
// map.addLayer(raster);
$("#details span").click(function () {
var name = $(this).attr("name");
switch (name) {
case "vector":
if (!map.getLayer("vector")) map.addLayer(vector);
break;
case "raster":
if (!map.getLayer("raster")) map.addLayer(raster);
break;
case "rvector":
if (map.getLayer("vector")) map.removeLayer(vector);
break;
case "rraster":
if (map.getLayer("raster")) map.removeLayer(raster);
break;
}
});
});
\</script>
\</head>
\<body class="claro">
\<div id="content" data-dojo-type="dijit.layout.BorderContainer" data-dojo-props="design:'headline', gutters:true"
style="width: 100%; height: 100%; margin: 0;" \>
\<div id="details" data-dojo-type="dijit.layout.ContentPane" data-dojo-props="region:'left', splitter:true"
style="overflow: auto; width: 200px;" \>
\<span name="vector">添加矢量图层\</span>
\<span name="raster">添加影像图层\</span>
\<span name="rvector">移除矢量图层\</span>
\<span name="rraster">移除影像图层\</span>
\</div>
\<div id="map" data-dojo-type="dijit.layout.ContentPane" data-dojo-props="region:'center'"
style="overflow: hidden;" \>\</div>
\</div>
\</body>
\</html>3.1.2图层
3.1.2.1弹出信息框
\<!DOCTYPE html>
\<html>
\<head>
\<meta http-equiv="Content-Type" content="text/html; charset=utf-8" />
\<meta name="viewport" content="initial-scale=1, maximum-scale=1,user-scalable=no" />
\<title>Map with infoWindow\</title>
\<link rel="stylesheet" href="http://1.1.1.1:8082/arcgis_js_api/3.24/dijit/themes/claro/claro.css" />
\<link rel="stylesheet" href="http://1.1.1.1:8082/arcgis_js_api/3.24/esri/css/esri.css" />
\<style>
html,
body,
\#map {
height: 100%;
width: 100%;
margin: 0;
padding: 0;
}
.esriControlsBR .logo-med {
display: none;
}
\</style>
\<script src="http://1.1.1.1:8082/arcgis_js_api/3.24/init.js">\</script>
\<script src="http://1.1.1.1:8082/jquery/jquery.js">\</script>
\<script>
var map;
require([
"esri/map",
"esri/layers/WFSLayer",
"esri/layers/WMSLayerInfo",
"esri/layers/ArcGISTiledMapServiceLayer",
"esri/geometry/Extent",
"dojo/_base/array",
"dojo/dom",
"dojo/dom-construct",
"dojo/parser",
"dijit/layout/BorderContainer",
"dijit/layout/ContentPane",
"dojo/domReady!",
], function (
Map,
WFSLayer,
WMSLayerInfo,
ArcGISTiledMapServiceLayer,
Extent,
array,
dom,
domConst,
parser
) {
parser.parse();
map = new Map("map", {
center: new esri.geometry.Point(
120.1594,
30.2571,
new esri.SpatialReference({ wkid: 4490 })
),
zoom: 3,
});
var layer = new ArcGISTiledMapServiceLayer(
"http://1.1.1.1:8080/68DE38F71E38CD8C508FAB3035752EA8ED8F9221EDE18FDBE593B01FCDD12BD296F09FE27CD7D2733AD075EAF994851B/PBS/rest/services/hzsyvector/Mapserver",
{
id: "vector",
}
);
map.addLayer(layer);
map.on('click', function (e) {
map.infoWindow.setTitle("详细信息");
map.infoWindow.setContent("当前坐标:" + e.mapPoint.x + "," + e.mapPoint.y);
map.infoWindow.show(e.mapPoint);
})
});
\</script>
\</head>
\<body class="claro">
\<div id="map" data-dojo-type="dijit.layout.ContentPane" data-dojo-props="region:'center'"
style="overflow: hidden;" \>\</div>
\</div>
\</body>
\</html>3.1.2.2矢量图层(wms)
\<!DOCTYPE html>
\<html>
\<head>
\<meta http-equiv="Content-Type" content="text/html; charset=utf-8" />
\<meta name="viewport" content="initial-scale=1, maximum-scale=1,user-scalable=no" />
\<title>Map with wmslayer\</title>
\<link rel="stylesheet" href="http://1.1.1.1:8082/arcgis_js_api/3.24/dijit/themes/claro/claro.css" />
\<link rel="stylesheet" href="http://1.1.1.1:8082/arcgis_js_api/3.24/esri/css/esri.css" />
\<style>
html,
body,
\#map {
height: 100%;
width: 100%;
margin: 0;
padding: 0;
}
.esriControlsBR .logo-med {
display: none;
}
\</style>
\<script src="http://1.1.1.1:8082/arcgis_js_api/3.24/init.js">\</script>
\<script src="http://1.1.1.1:8082/jquery/jquery.js">\</script>
\<script>
var map;
require([
"esri/map",
"esri/layers/WMSLayer",
"esri/layers/WMSLayerInfo",
"esri/layers/ArcGISTiledMapServiceLayer",
"esri/geometry/Extent",
"dojo/_base/array",
"dojo/dom",
"dojo/dom-construct",
"dojo/parser",
"dijit/layout/BorderContainer",
"dijit/layout/ContentPane",
"dojo/domReady!",
], function (
Map,
WMSLayer,
WMSLayerInfo,
ArcGISTiledMapServiceLayer,
Extent,
array,
dom,
domConst,
parser
) {
parser.parse();
map = new Map("map", {
center: new esri.geometry.Point(
120.1594,
30.2571,
new esri.SpatialReference({ wkid: 4490 })
),
zoom: 3,
});
var layer = new ArcGISTiledMapServiceLayer(
"http://1.1.1.1:8080/68DE38F71E38CD8C508FAB3035752EA8ED8F9221EDE18FDBE593B01FCDD12BD296F09FE27CD7D2733AD075EAF994851B/PBS/rest/services/hzsyvector/Mapserver",
{
id: "vector",
}
);
map.addLayer(layer);
map.on("load", function () {
var extent = map.extent;
var url =
"http://1.1.1.1:8080/68DE38F71E38CD8C508FAB3035752EA8ED8F9221EDE18FDBE593B01FCDD12BD296F09FE27CD7D2733AD075EAF994851B/PBS/rest/services/lsyt_dmdz_qxbj0619/MapServer/wms";
var resourceInfo = {
extent: extent,
layerInfos: [],
version: "1.1.1",
visibleLayers: ["1"],
};
var wmslayer = new esri.layers.WMSLayer(url, {
resourceInfo: resourceInfo,
});
wmslayer.setImageFormat("png");
wmslayer.setVisibleLayers("gpserver");
map.addLayer(wmslayer);
});
});
\</script>
\</head>
\<body class="claro">
\<div id="map" data-dojo-type="dijit.layout.ContentPane" data-dojo-props="region:'center'"
style="overflow: hidden;" \>\</div>
\</div>
\</body>
\</html>3.1.2.3矢量图层(wfs)
\<!DOCTYPE html>
\<html>
\<head>
\<meta http-equiv="Content-Type" content="text/html; charset=utf-8" />
\<meta name="viewport" content="initial-scale=1, maximum-scale=1,user-scalable=no" />
\<title>Map with wfslayer\</title>
\<link rel="stylesheet" href="http://1.1.1.1:8082/arcgis_js_api/3.24/dijit/themes/claro/claro.css" />
\<link rel="stylesheet" href="http://1.1.1.1:8082/arcgis_js_api/3.24/esri/css/esri.css" />
\<style>
html,
body,
\#map {
height: 100%;
width: 100%;
margin: 0;
padding: 0;
}
.esriControlsBR .logo-med {
display: none;
}
\</style>
\<script src="http://1.1.1.1:8082/arcgis_js_api/3.24/init.js">\</script>
\<script src="http://1.1.1.1:8082/jquery/jquery.js">\</script>
\<script>
var map, symbol;
require([
"esri/map",
"esri/layers/WFSLayer",
"esri/layers/WMSLayerInfo",
"esri/layers/ArcGISTiledMapServiceLayer",
"esri/symbols/SimpleLineSymbol",
"esri/symbols/SimpleFillSymbol",
"esri/graphic",
"esri/geometry/Extent",
"esri/geometry/Polygon",
"dojo/_base/array",
"dojo/dom",
"dojo/dom-construct",
"dojo/parser",
"dijit/layout/BorderContainer",
"dijit/layout/ContentPane",
"dojo/domReady!",
], function (
Map,
WFSLayer,
WMSLayerInfo,
ArcGISTiledMapServiceLayer,
SimpleLineSymbol,
SimpleFillSymbol,
Graphic,
Extent,
Polygon,
array,
dom,
domConst,
parser
) {
parser.parse();
map = new Map("map", {
center: new esri.geometry.Point(
120.1594,
30.2571,
new esri.SpatialReference({ wkid: 4490 })
),
zoom: 3,
});
var layer = new ArcGISTiledMapServiceLayer(
"http://1.1.1.1:8080/68DE38F71E38CD8C508FAB3035752EA8ED8F9221EDE18FDBE593B01FCDD12BD296F09FE27CD7D2733AD075EAF994851B/PBS/rest/services/hzsyvector/Mapserver",
{
id: "vector",
}
);
map.addLayer(layer);
map.on("load", function () {
var extent = map.extent;
var url =
"http://1.1.1.1:8080/68DE38F71E38CD8C508FAB3035752EA8ED8F9221EDE18FDBE593B01FCDD12BD296F09FE27CD7D2733AD075EAF994851B/PBS/rest/services/lsyt_dmdz_qxbj0619/MapServer/wfs?service=wfs&version=1.0.0&request=getfeature&typename=lsyt_dmdz_qxbj0619&outputFormat=application/json";
$.ajax({
url: url,
success: function (data) {
console.log(data);
var text = JSON.parse(data);
for (var i = 0; i \< text.features.length; i++) {
symbol = new SimpleFillSymbol();
if (text.features[i].geometry.type == "Polygon") {
var polygonjson = {
"rings": text.features[i].geometry.coordinates[0],
"spatialReference": { "wkid": 4490 }
}
var poly = new Polygon(polygonjson)
var graphic = new Graphic(poly, symbol);
//var gra = new Graphic(text.features[i].geometry, symbol);
map.graphics.add(graphic);
} else if (text.features[i].geometry.type == "MultiPolygon") {
var len = text.features[i].geometry.coordinates.length;
for (var k = 0; k \< len; k++) {
var polygonjson = {
"rings": text.features[i].geometry.coordinates[k],
"spatialReference": { "wkid": 4490 }
}
var poly = new Polygon(polygonjson)
var graphic = new Graphic(poly, symbol);
map.graphics.add(graphic);
}
} else {
alert();
}
}
}
});
});
});
\</script>
\</head>
\<body class="claro">
\<div id="map" data-dojo-type="dijit.layout.ContentPane" data-dojo-props="region:'center'"
style="overflow: hidden;" \>\</div>
\</div>
\</body>
\</html>3.1.3查询
3.1.3.1点查询
\<!DOCTYPE html>
\<html>
\<head>
\<meta http-equiv="Content-Type" content="text/html; charset=utf-8" />
\<meta name="viewport" content="initial-scale=1, maximum-scale=1,user-scalable=no" />
\<title>Query By Point\</title>
\<link rel="stylesheet" href="http://1.1.1.1:8082/arcgis_js_api/3.24/dijit/themes/claro/claro.css" />
\<link rel="stylesheet" href="http://1.1.1.1:8082/arcgis_js_api/3.24/esri/css/esri.css" />
\<style>
html,
body,
\#map {
height: 100%;
width: 100%;
margin: 0;
padding: 0;
}
\</style>
\<script src="http://1.1.1.1:8082/arcgis_js_api/3.24/init.js">\</script>
\<script src="http://1.1.1.1:8082/jquery/jquery.js">\</script>
\<script>
var map;
require([
"esri/map",
"esri/layers/WMSLayer",
"esri/layers/WMSLayerInfo",
"esri/layers/ArcGISTiledMapServiceLayer",
"esri/geometry/Extent",
"dojo/_base/array",
"dojo/dom",
"dojo/dom-construct",
"dojo/parser",
"dijit/layout/BorderContainer",
"dijit/layout/ContentPane",
"dojo/domReady!",
], function (
Map,
WMSLayer,
WMSLayerInfo,
ArcGISTiledMapServiceLayer,
Extent,
array,
dom,
domConst,
parser
) {
parser.parse();
map = new Map("map", {
// basemap: "streets",
// center: [120.1594, 30.2571],
center: new esri.geometry.Point(
120.1594,
30.2571,
new esri.SpatialReference({ wkid: 4490 })
),
zoom: 3,
});
var layer2 = new ArcGISTiledMapServiceLayer(
"http://1.1.1.1/e8b4611714092ac7bc35cb5e8d476e4824f85f3a/Tile/ArcGISREST/hzsyvector.gis",
{
// id: layerInfo.LayerName,
id: "底图",
}
);
map.addLayer(layer2);
map.on("load", function () {
var extent = map.extent;
var url =
"http://1.1.1.1:8080/68DE38F71E38CD8C508FAB3035752EA8ED8F9221EDE18FDBE593B01FCDD12BD296F09FE27CD7D2733AD075EAF994851B/PBS/rest/services/lsyt_dmdz_qxbj0619/MapServer/wms";
var resourceInfo = {
extent: extent,
layerInfos: [],
version: "1.1.1",
visibleLayers: ["1"],
};
var wmslayer = new esri.layers.WMSLayer(url, {
resourceInfo: resourceInfo,
});
wmslayer.setImageFormat("png");
wmslayer.setVisibleLayers("gpserver");
map.addLayer(wmslayer);
});
map.on("click", function (e) {
console.log("获取到的点" + e);
var point = e.mapPoint.x + "," + e.mapPoint.y + "," + e.mapPoint.x + "," + e.mapPoint.y;// "120.16271670916996,30.251675868508478,120.1713094144393,30.25591314629446";
var qurl =
"http://1.1.1.1:8080/68DE38F71E38CD8C508FAB3035752EA8ED8F9221EDE18FDBE593B01FCDD12BD296F09FE27CD7D2733AD075EAF994851B/PBS/rest/services/lsyt_dmdz_qxbj0619/MapServer/wfs?service=wfs&version=1.0.0&request=getfeature&typename=lsyt_dmdz_qxbj0619&outputFormat=application/json&CQL_FILTER=BBOX(geom," + point + ")";
$.ajax({
url: qurl,
success: function (data) {
console.log(data);
var text = JSON.parse(data);
$('#details').html(text.features[1].properties['quxian']);
}
});
});
});
\</script>
\</head>
\<body class="claro">
\<div id="content" data-dojo-type="dijit.layout.BorderContainer" data-dojo-props="design:'headline', gutters:true"
style="width: 100%; height: 100%; margin: 0;" \>
\<div id="details" data-dojo-type="dijit.layout.ContentPane" data-dojo-props="region:'left', splitter:true"
style="overflow: auto; width: 200px;" \>\</div>
\<div id="map" data-dojo-type="dijit.layout.ContentPane" data-dojo-props="region:'center'"
style="overflow: hidden;" \>\</div>
\</div>
\</body>
\</html>3.1.3.2面查询
\<!DOCTYPE html>
\<html>
\<head>
\<meta http-equiv="Content-Type" content="text/html; charset=utf-8" />
\<meta name="viewport" content="initial-scale=1, maximum-scale=1,user-scalable=no" />
\<title>Query By Rectangle\</title>
\<link rel="stylesheet" href="http://1.1.1.1:8082/arcgis_js_api/3.24/dijit/themes/claro/claro.css" />
\<link rel="stylesheet" href="http://1.1.1.1:8082/arcgis_js_api/3.24/esri/css/esri.css" />
\<style>
html,
body,
\#map {
height: 100%;
width: 100%;
margin: 0;
padding: 0;
}
\</style>
\<script src="http://1.1.1.1:8082/arcgis_js_api/3.24/init.js">\</script>
\<script src="http://1.1.1.1:8082/jquery/jquery.js">\</script>
\<script>
var map, toolbar;
require([
"esri/map",
"esri/layers/WMSLayer",
"esri/layers/WMSLayerInfo",
"esri/toolbars/draw",
"esri/symbols/SimpleLineSymbol",
"esri/symbols/SimpleFillSymbol",
"esri/graphic",
"esri/layers/ArcGISTiledMapServiceLayer",
"esri/geometry/Extent",
"dojo/_base/array",
"dojo/dom",
"dojo/dom-construct",
"dojo/parser",
"dijit/layout/BorderContainer",
"dijit/layout/ContentPane",
"dojo/domReady!",
], function (
Map,
WMSLayer,
WMSLayerInfo,
Draw,
SimpleLineSymbol,
SimpleFillSymbol,
Graphic,
ArcGISTiledMapServiceLayer,
Extent,
array,
dom,
domConst,
parser
) {
parser.parse();
map = new Map("map", {
// basemap: "streets",
// center: [120.1594, 30.2571],
center: new esri.geometry.Point(
120.1594,
30.2571,
new esri.SpatialReference({ wkid: 4490 })
),
zoom: 3,
});
var layer2 = new ArcGISTiledMapServiceLayer(
"http://1.1.1.1/e8b4611714092ac7bc35cb5e8d476e4824f85f3a/Tile/ArcGISREST/hzsyvector.gis",
{
// id: layerInfo.LayerName,
id: "底图",
}
);
map.addLayer(layer2);
map.on("load", function () {
var extent = map.extent;
var url =
"http://1.1.1.1:8080/68DE38F71E38CD8C508FAB3035752EA8ED8F9221EDE18FDBE593B01FCDD12BD296F09FE27CD7D2733AD075EAF994851B/PBS/rest/services/lsyt_dmdz_qxbj0619/MapServer/wms";
var resourceInfo = {
extent: extent,
layerInfos: [],
version: "1.1.1",
visibleLayers: ["1"],
};
var wmslayer = new esri.layers.WMSLayer(url, {
resourceInfo: resourceInfo,
});
wmslayer.setImageFormat("png");
wmslayer.setVisibleLayers("gpserver");
map.addLayer(wmslayer);
toolbar = new Draw(map);
toolbar.on("draw-end", showinfo);
toolbar.activate(Draw["RECTANGLE"]);
});
function showinfo(evt) {
var symbol;
toolbar.deactivate();
map.graphics.clear();
symbol = new SimpleFillSymbol();
var graphic = new Graphic(evt.geometry, symbol);
map.graphics.add(graphic);
getAttr(evt.geometry);
}
function getAttr(geo) {
var point =
geo.cache._extent.xmin +
"," +
geo.cache._extent.ymin +
"," +
geo.cache._extent.xmax +
"," +
geo.cache._extent.ymax; // "120.16271670916996,30.251675868508478,120.1713094144393,30.25591314629446";
var qurl = "http://1.1.1.1:8080/68DE38F71E38CD8C508FAB3035752EA8ED8F9221EDE18FDBE593B01FCDD12BD296F09FE27CD7D2733AD075EAF994851B/PBS/rest/services/lsyt_dmdz_qxbj0619/MapServer/wfs?service=wfs&version=1.0.0&request=getfeature&typename=lsyt_dmdz_qxbj0619&outputFormat=application/json&CQL_FILTER=BBOX(geom," + point + ")";
$.ajax({
url: qurl,
success: function (data) {
console.log(data);
var text = JSON.parse(data);
var attr = "";
for (var i = 0; i \< text.features.length; i++) {
attr += text.features[i].properties["quxian"] + "\</br>";
}
$("#details").html(attr);
toolbar.activate(Draw["RECTANGLE"]);
},
});
}
});
\</script>
\</head>
\<body class="claro">
\<div id="content" data-dojo-type="dijit.layout.BorderContainer" data-dojo-props="design:'headline', gutters:true"
style="width: 100%; height: 100%; margin: 0;" \>
\<div id="details" data-dojo-type="dijit.layout.ContentPane" data-dojo-props="region:'left', splitter:true"
style="overflow: auto; width: 200px;" \>\</div>
\<div id="map" data-dojo-type="dijit.layout.ContentPane" data-dojo-props="region:'center'"
style="overflow: hidden;" \>\</div>
\</div>
\</body>
\</html>3.1.3.3属性查询
\<!DOCTYPE html>
\<html>
\<head>
\<meta http-equiv="Content-Type" content="text/html; charset=utf-8" />
\<meta name="viewport" content="initial-scale=1, maximum-scale=1,user-scalable=no" />
\<title>Query by Attr\</title>
\<link rel="stylesheet" href="http://1.1.1.1:8082/arcgis_js_api/3.24/dijit/themes/claro/claro.css" />
\<link rel="stylesheet" href="http://1.1.1.1:8082/arcgis_js_api/3.24/esri/css/esri.css" />
\<style>
html,
body,
\#map {
height: 100%;
width: 100%;
margin: 0;
padding: 0;
}
\</style>
\<script src="http://1.1.1.1:8082/arcgis_js_api/3.24/init.js">\</script>
\<script src="http://1.1.1.1:8082/jquery/jquery.js">\</script>
\<script>
var map;
require([
"esri/map",
"esri/layers/WMSLayer",
"esri/layers/WMSLayerInfo",
"esri/layers/ArcGISTiledMapServiceLayer",
"esri/geometry/Extent",
"dojo/_base/array",
"dojo/dom",
"dojo/dom-construct",
"dojo/parser",
"dijit/layout/BorderContainer",
"dijit/layout/ContentPane",
"dojo/domReady!",
], function (
Map,
WMSLayer,
WMSLayerInfo,
ArcGISTiledMapServiceLayer,
Extent,
array,
dom,
domConst,
parser
) {
parser.parse();
map = new Map("map", {
center: new esri.geometry.Point(
120.1594,
30.2571,
new esri.SpatialReference({ wkid: 4490 })
),
zoom: 3,
});
var layer2 = new ArcGISTiledMapServiceLayer(
"http://1.1.1.1/e8b4611714092ac7bc35cb5e8d476e4824f85f3a/Tile/ArcGISREST/hzsyvector.gis",
{
id: "底图",
}
);
map.addLayer(layer2);
map.on("load", function () {
var extent = map.extent;
var url =
"http://1.1.1.1:8080/68DE38F71E38CD8C508FAB3035752EA8ED8F9221EDE18FDBE593B01FCDD12BD296F09FE27CD7D2733AD075EAF994851B/PBS/rest/services/lsyt_dmdz_qxbj0619/MapServer/wms";
var resourceInfo = {
extent: extent,
layerInfos: [],
version: "1.1.1",
visibleLayers: ["1"],
};
var wmslayer = new esri.layers.WMSLayer(url, {
resourceInfo: resourceInfo,
});
wmslayer.setImageFormat("png");
wmslayer.setVisibleLayers("gpserver");
map.addLayer(wmslayer);
});
map.on("click", function (e) {
console.log("获取到的点" + e);
var point =
"120.16271670916996,30.251675868508478,120.1713094144393,30.25591314629446"; // "120.16271670916996,30.251675868508478,120.1713094144393,30.25591314629446";
var qurl =
"http://1.1.1.1:8080/68DE38F71E38CD8C508FAB3035752EA8ED8F9221EDE18FDBE593B01FCDD12BD296F09FE27CD7D2733AD075EAF994851B/PBS/rest/services/lsyt_dmdz_qxbj0619/MapServer/wfs?service=wfs&version=1.0.0&request=getfeature&typename=lsyt_dmdz_qxbj0619&outputFormat=application/json&CQL_FILTER=BBOX(geom," +
point +
")";
qurl += " and quxian='上城区'";
$.ajax({
url: qurl,
success: function (data) {
console.log(data);
var text = JSON.parse(data);
var attr = "";
for (var i = 0; i \< text.features.length; i++) {
attr += text.features[i].properties["quxian"] + "\</br>";
}
$("#details").html(attr);
},
});
});
});
\</script>
\</head>
\<body class="claro">
\<div id="content" data-dojo-type="dijit.layout.BorderContainer" data-dojo-props="design:'headline', gutters:true"
style="width: 100%; height: 100%; margin: 0;" \>
\<div id="details" data-dojo-type="dijit.layout.ContentPane" data-dojo-props="region:'left', splitter:true"
style="overflow: auto; width: 200px;" \>点击地图实现按属性查询(区县=上城区)\</div>
\<div id="map" data-dojo-type="dijit.layout.ContentPane" data-dojo-props="region:'center'"
style="overflow: hidden;" \>\</div>
\</div>
\</body>
\</html>3.1.3.4组合查询
\<html>
\<head>
\<meta http-equiv="Content-Type" content="text/html; charset=utf-8" />
\<meta name="viewport" content="initial-scale=1, maximum-scale=1,user-scalable=no" />
\<title>Query\</title>
\<link rel="stylesheet" href="http://1.1.1.1:8082/arcgis_js_api/3.24/dijit/themes/claro/claro.css" />
\<link rel="stylesheet" href="http://1.1.1.1:8082/arcgis_js_api/3.24/esri/css/esri.css" />
\<style>
html,
body,
\#map {
height: 100%;
width: 100%;
margin: 0;
padding: 0;
}
\</style>
\<script src="http://1.1.1.1:8082/arcgis_js_api/3.24/init.js">\</script>
\<script src="http://1.1.1.1:8082/jquery/jquery.js">\</script>
\<script>
var map, toolbar;
require([
"esri/map",
"esri/layers/WMSLayer",
"esri/layers/WMSLayerInfo",
"esri/toolbars/draw",
"esri/symbols/SimpleLineSymbol",
"esri/symbols/SimpleFillSymbol",
"esri/graphic",
"esri/layers/ArcGISTiledMapServiceLayer",
"esri/geometry/Extent",
"dojo/_base/array",
"dojo/dom",
"dojo/dom-construct",
"dojo/parser",
"dijit/layout/BorderContainer",
"dijit/layout/ContentPane",
"dojo/domReady!",
], function (
Map,
WMSLayer,
WMSLayerInfo,
Draw,
SimpleLineSymbol,
SimpleFillSymbol,
Graphic,
ArcGISTiledMapServiceLayer,
Extent,
array,
dom,
domConst,
parser
) {
parser.parse();
map = new Map("map", {
center: new esri.geometry.Point(
120.1594,
30.2571,
new esri.SpatialReference({ wkid: 4490 })
),
zoom: 3,
});
var layer2 = new ArcGISTiledMapServiceLayer(
"http://1.1.1.1/e8b4611714092ac7bc35cb5e8d476e4824f85f3a/Tile/ArcGISREST/hzsyvector.gis",
{
id: "底图",
}
);
map.addLayer(layer2);
map.on("load", function () {
var extent = map.extent;
var url =
"http://1.1.1.1:8080/68DE38F71E38CD8C508FAB3035752EA8ED8F9221EDE18FDBE593B01FCDD12BD296F09FE27CD7D2733AD075EAF994851B/PBS/rest/services/lsyt_dmdz_qxbj0619/MapServer/wms";
var resourceInfo = {
extent: extent,
layerInfos: [],
version: "1.1.1",
visibleLayers: ["1"],
};
var wmslayer = new esri.layers.WMSLayer(url, {
resourceInfo: resourceInfo,
});
wmslayer.setImageFormat("png");
wmslayer.setVisibleLayers("gpserver");
map.addLayer(wmslayer);
toolbar = new Draw(map);
toolbar.on("draw-end", showinfo);
toolbar.activate(Draw["RECTANGLE"]);
});
function showinfo(evt) {
var symbol;
toolbar.deactivate();
map.graphics.clear();
symbol = new SimpleFillSymbol();
var graphic = new Graphic(evt.geometry, symbol);
map.graphics.add(graphic);
getAttr(evt.geometry);
}
function getAttr(geo) {
var point =
geo.cache._extent.xmin +
"," +
geo.cache._extent.ymin +
"," +
geo.cache._extent.xmax +
"," +
geo.cache._extent.ymax; // "120.16271670916996,30.251675868508478,120.1713094144393,30.25591314629446";
var qurl =
"http://1.1.1.1:8080/68DE38F71E38CD8C508FAB3035752EA8ED8F9221EDE18FDBE593B01FCDD12BD296F09FE27CD7D2733AD075EAF994851B/PBS/rest/services/lsyt_dmdz_qxbj0619/MapServer/wfs?service=wfs&version=1.0.0&request=getfeature&typename=lsyt_dmdz_qxbj0619&outputFormat=application/json&CQL_FILTER=BBOX(geom," +
point +
")";
qurl += " and quxian='上城区'";
$.ajax({
url: qurl,
success: function (data) {
console.log(data);
var text = JSON.parse(data);
var attr = "";
for (var i = 0; i \< text.features.length; i++) {
attr += text.features[i].properties["quxian"] + "\</br>";
}
$("#details").html(attr);
toolbar.activate(Draw["RECTANGLE"]);
},
});
}
});
\</script>
\</head>
\<body class="claro">
\<div id="content" data-dojo-type="dijit.layout.BorderContainer" data-dojo-props="design:'headline', gutters:true"
style="width: 100%; height: 100%; margin: 0;" \>
\<div id="details" data-dojo-type="dijit.layout.ContentPane" data-dojo-props="region:'left', splitter:true"
style="overflow: auto; width: 200px;" \>在框选范围内查询属性(区县=上城区)的数据\</div>
\<div id="map" data-dojo-type="dijit.layout.ContentPane" data-dojo-props="region:'center'"
style="overflow: hidden;" \>\</div>
\</div>
\</body>
\</html><!DOCTYPE html>
Openlayers
OpenLayers 是一个专为Web GIS 客户端开发提供的JavaScript 类库包,用于实现标准格式发布的地图数据访问。OpenLayers实现访问地理空间数据的方法都符合行业标准。OpenLayers 支持Open GIS 协会制定的WMS(Web Mapping Service)和WFS(Web Feature Service)等网络服务规范,可以通过远程服务的方式,将以OGC 服务形式发布的地图数据加载到基于浏览器的OpenLayers 客户端中进行显示。详细见官方网站https://openlayers.org/
地图
矢量电子地图
\<!DOCTYPE html>
\<html>
\<head>
  \<meta charset="UTF-8">
  \<title>添加电子地图\</title>
  \<link rel="stylesheet" href="http://1.1.1.1:8082/openlayer/v3.20.1/css/ol.css" type="text/css">
  \<script src="http://1.1.1.1:8082/openlayer/v3.20.1/build/ol.js">\</script>
\</head>
\<body>
  \<div id="map" class="map">\</div>
  \<script>
    var format = 'image/png';
    var bounds = [119.347618103027, 29.7052669525146,
      120.698570251465, 30.5366992950439
    ];
    var projection = new ol.proj.Projection({
      code: 'EPSG:4490',
      units: 'degrees',
      axisOrientation: 'neu',
      global: true
    });
    var fullExtent = [118.33968849655, 29.188589472, 120.71408849655, 30.5651894750343];
    var resolutions = [
      0.00549933137239034,
      0.00274966568619517,
      0.00137483284309758,
      0.000687416421548792,
      0.000343708210774396,
      0.000171854105387198,
      8.5927052693599E-05,
      4.29635263467995E-05,
      2.14817631733998E-05,
      1.07408815866999E-05,
      5.37044079334994E-06,
      2.68522039667497E-06,
      1.34261019833748E-06,
    ];
    var tileGrid = new ol.tilegrid.TileGrid({
      tileSize: 256,
      origin: [118.122911693886, 31.2869311022836],
      extent: fullExtent,
      resolutions: resolutions
    });
    // ol.source.XYZ添加瓦片地图的层
    var tileLayer = new ol.layer.Tile({
      source: new ol.source.XYZ({
        tileGrid: tileGrid,
        tileUrlFunction: function (tileCoord) {
          var z = tileCoord[0];
          var x = tileCoord[1];
          var y = (-tileCoord[2] - 1);
          var url = 'http://1.1.1.1:8080/68DE38F71E38CD8C508FAB3035752EA8ED8F9221EDE18FDBE593B01FCDD12BD296F09FE27CD7D2733AD075EAF994851B/PBS/rest/services/hzsyvector/Mapserver/tile/' +
            z + '/' + y + '/' + x;
          console.log(url);
          return url;
        },
        projection: 'EPSG:4490'
      })
    });
    var map = new ol.Map({
      target: 'map',
      layers: [
        tileLayer
      ],
      view: new ol.View({
        projection: projection
      })
    });
    map.getView().fit(bounds, map.getSize()); //非常重要
  \</script>
\</body>
\</html>
影像电子地图
<!DOCTYPE html>
<html>
<head>
<meta charset="UTF-8">
<title>添加电子地图</title>
<link rel="stylesheet" href="http://1.1.1.1:8082/openlayer/v3.20.1/css/ol.css" type="text/css">
<script src="http://1.1.1.1:8082/openlayer/v3.20.1/build/ol.js"></script>
</head>
<body>
<div id="map" class="map"></div>
<script>
var format = 'image/png';
var bounds = [119.347618103027, 29.7052669525146,
120.698570251465, 30.5366992950439
];
var projection = new ol.proj.Projection({
code: 'EPSG:4490',
units: 'degrees',
axisOrientation: 'neu',
global: true
});
var fullExtent = [118.33968849655, 29.188589472, 120.71408849655, 30.5651894750343];
var resolutions = [
0.00549933137239034,
0.00274966568619517,
0.00137483284309758,
0.000687416421548792,
0.000343708210774396,
0.000171854105387198,
8.5927052693599E-05,
4.29635263467995E-05,
2.14817631733998E-05,
1.07408815866999E-05,
5.37044079334994E-06,
2.68522039667497E-06,
1.34261019833748E-06,
];
var tileGrid = new ol.tilegrid.TileGrid({
tileSize: 256,
origin: [118.122911693886, 31.2869311022836],
extent: fullExtent,
resolutions: resolutions
});
// ol.source.XYZ添加瓦片地图的层
var tileLayer = new ol.layer.Tile({
source: new ol.source.XYZ({
tileGrid: tileGrid,
tileUrlFunction: function (tileCoord) {
var z = tileCoord[0];
var x = tileCoord[1];
var y = (-tileCoord[2] - 1);
var url = 'http://1.1.1.1:8080/68DE38F71E38CD8C508FAB3035752EA8ED8F9221EDE18FDBE593B01FCDD12BD296F09FE27CD7D2733AD075EAF994851B/PBS/rest/services/hzsyraster/Mapserver/tile/' +
z + '/' + y + '/' + x;
console.log(url);
return url;
},
projection: 'EPSG:4490'
})
});
var map = new ol.Map({
target: 'map',
layers: [
tileLayer
],
view: new ol.View({
projection: projection
})
});
map.getView().fit(bounds, map.getSize()); //非常重要
</script>
</body>
</html>
图层
弹出框信息框
\<!DOCTYPE html>
\<html>
\<head>
  \<meta charset="UTF-8" />
  \<title>弹出信息框\</title>
  \<link rel="stylesheet" href="http://1.1.1.1:8082/openlayer/v3.20.1/css/ol.css" type="text/css" />
  \<script src="http://1.1.1.1:8082/openlayer/v3.20.1/build/ol.js">\</script>
  \<script src="http://1.1.1.1:8082/jquery/jquery.js">\</script>
\</head>
\<style>
  #map {
    height: 100%;
    width: 100%;
  }
  #mypopup {
    background: #fff;
  }
\</style>
\<body>
  \<div id="map" class="map">\</div>
  \<div id="mypopup">
    \<div id="mypopup-content">内容自定义\</div>
    \<button id="closeOverlay">关闭\</button>
  \</div>
  \<script>
    var format = "image/png";
    var bounds = [
      119.347618103027,
      29.7052669525146,
      120.698570251465,
      30.5366992950439,
    ];
    var projection = new ol.proj.Projection({
      code: "EPSG:4490",
      units: "degrees",
      axisOrientation: "neu",
      global: true,
    });
    var fullExtent = [
      118.33968849655,
      29.188589472,
      120.71408849655,
      30.5651894750343,
    ];
    var resolutions = [
      0.00549933137239034,
      0.00274966568619517,
      0.00137483284309758,
      0.000687416421548792,
      0.000343708210774396,
      0.000171854105387198,
      8.5927052693599e-5,
      4.29635263467995e-5,
      2.14817631733998e-5,
      1.07408815866999e-5,
      5.37044079334994e-6,
      2.68522039667497e-6,
      1.34261019833748e-6,
    ];
    var tileGrid = new ol.tilegrid.TileGrid({
      tileSize: 256,
      origin: [118.122911693886, 31.2869311022836],
      extent: fullExtent,
      resolutions: resolutions,
    });
    // ol.source.XYZ添加瓦片地图的层
    var tileLayer = new ol.layer.Tile({
      source: new ol.source.XYZ({
        tileGrid: tileGrid,
        tileUrlFunction: function (tileCoord) {
          var z = tileCoord[0];
          var x = tileCoord[1];
          var y = -tileCoord[2] - 1;
          var url =
            "http://1.1.1.1:8080/68DE38F71E38CD8C508FAB3035752EA8ED8F9221EDE18FDBE593B01FCDD12BD296F09FE27CD7D2733AD075EAF994851B/PBS/rest/services/hzsyvector/Mapserver/tile/" +
            z +
            "/" +
            y +
            "/" +
            x;
          // console.log(url);
          return url;
        },
        projection: "EPSG:4490",
      }),
    });
    var info = $("#mypopup");
    var content = $("#mypopup-content");
    var overlay = new ol.Overlay({
      element: info[0],
      autopan: true,
      autoPanMargin: 20,
      positioning: "center-center",
    });
    //map.addOverlay(overlay);
    var map = new ol.Map({
      target: "map",
      layers: [tileLayer],
      overlays: [overlay],
      view: new ol.View({
        projection: projection,
      }),
    });
    map.getView().fit(bounds, map.getSize()); //非常重要
    $("#closeOverlay").click(function () {
      info.hide();
      return false;
    });
    map.on("click", function (e) {
      var location = e.coordinate;
      content.html("这是信息框");
      info.show();
      overlay.setPosition(location);
    });
  \</script>
\</body>
\</html>
矢量图层(wms)
\<!DOCTYPE html>
\<html>
\<head>
  \<meta charset="UTF-8">
  \<title>添加电子地图\</title>
  \<link rel="stylesheet" href="http://1.1.1.1:8082/openlayer/v3.20.1/css/ol.css" type="text/css">
  \<script src="http://1.1.1.1:8082/openlayer/v3.20.1/build/ol.js">\</script>
\</head>
\<body>
  \<div id="map" class="map">\</div>
  \<script>
    var format = 'image/png';
    var bounds = [119.347618103027, 29.7052669525146,
      120.698570251465, 30.5366992950439
    ];
    var projection = new ol.proj.Projection({
      code: 'EPSG:4490',
      units: 'degrees',
      axisOrientation: 'neu',
      global: true
    });
    var fullExtent = [118.33968849655, 29.188589472, 120.71408849655, 30.5651894750343];
    var resolutions = [
      0.00549933137239034,
      0.00274966568619517,
      0.00137483284309758,
      0.000687416421548792,
      0.000343708210774396,
      0.000171854105387198,
      8.5927052693599E-05,
      4.29635263467995E-05,
      2.14817631733998E-05,
      1.07408815866999E-05,
      5.37044079334994E-06,
      2.68522039667497E-06,
      1.34261019833748E-06,
    ];
    var tileGrid = new ol.tilegrid.TileGrid({
      tileSize: 256,
      origin: [118.122911693886, 31.2869311022836],
      extent: fullExtent,
      resolutions: resolutions
    });
    // ol.source.XYZ添加瓦片地图的层
    var tileLayer = new ol.layer.Tile({
      source: new ol.source.XYZ({
        tileGrid: tileGrid,
        tileUrlFunction: function (tileCoord) {
          var z = tileCoord[0];
          var x = tileCoord[1];
          var y = (-tileCoord[2] - 1);
          var url = 'http://1.1.1.1:8080/68DE38F71E38CD8C508FAB3035752EA8ED8F9221EDE18FDBE593B01FCDD12BD296F09FE27CD7D2733AD075EAF994851B/PBS/rest/services/hzsyvector/Mapserver/tile/' +
            z + '/' + y + '/' + x;
          console.log(url);
          return url;
        },
        projection: 'EPSG:4490'
      })
    });
    var untiled = new ol.layer.Image({
      source: new ol.source.ImageWMS({
        ratio: 1,
        //url: 'http://126.10.2.27:8080/geoserver/gpserver/wms',
        url: 'http://1.1.1.1:8080/68DE38F71E38CD8C508FAB3035752EA8ED8F9221EDE18FDBE593B01FCDD12BD296F09FE27CD7D2733AD075EAF994851B/PBS/rest/services/lsyt_dmdz_qxbj0619/MapServer/wms?',
        params: {
          'FORMAT': format,
          'VERSION': '1.1.1',
          "LAYERS": 'lsyt_dmdz_qxbj0619',
          "exceptions": 'application/vnd.ogc.se_inimage',
        }
      })
    });
    var map = new ol.Map({
      target: 'map',
      layers: [
        tileLayer,
        untiled
      ],
      view: new ol.View({
        projection: projection
      })
    });
    map.getView().fit(bounds, map.getSize()); //非常重要
  \</script>
\</body>
\</html>
矢量图层(wfs)
\<!DOCTYPE html>
\<html>
\<head>
  \<meta charset="UTF-8" />
  \<title>添加WFS电子地图\</title>
  \<link rel="stylesheet" href="http://1.1.1.1:8082/openlayer/v3.20.1/css/ol.css" type="text/css" />
  \<script src="http://1.1.1.1:8082/openlayer/v3.20.1/build/ol.js">\</script>
\</head>
\<body>
  \<div id="map" class="map">\</div>
  \<script>
    var format = "image/png";
    var bounds = [
      119.347618103027,
      29.7052669525146,
      120.698570251465,
      30.5366992950439,
    ];
    var projection = new ol.proj.Projection({
      code: "EPSG:4490",
      units: "degrees",
      axisOrientation: "neu",
      global: true,
    });
    var fullExtent = [
      118.33968849655,
      29.188589472,
      120.71408849655,
      30.5651894750343,
    ];
    var resolutions = [
      0.00549933137239034,
      0.00274966568619517,
      0.00137483284309758,
      0.000687416421548792,
      0.000343708210774396,
      0.000171854105387198,
      8.5927052693599e-5,
      4.29635263467995e-5,
      2.14817631733998e-5,
      1.07408815866999e-5,
      5.37044079334994e-6,
      2.68522039667497e-6,
      1.34261019833748e-6,
    ];
    var tileGrid = new ol.tilegrid.TileGrid({
      tileSize: 256,
      origin: [118.122911693886, 31.2869311022836],
      extent: fullExtent,
      resolutions: resolutions,
    });
    // ol.source.XYZ添加瓦片地图的层
    var tileLayer = new ol.layer.Tile({
      source: new ol.source.XYZ({
        tileGrid: tileGrid,
        tileUrlFunction: function (tileCoord) {
          var z = tileCoord[0];
          var x = tileCoord[1];
          var y = -tileCoord[2] - 1;
          var url =
            "http://1.1.1.1:8080/68DE38F71E38CD8C508FAB3035752EA8ED8F9221EDE18FDBE593B01FCDD12BD296F09FE27CD7D2733AD075EAF994851B/PBS/rest/services/hzsyvector/Mapserver/tile/" +
            z +
            "/" +
            y +
            "/" +
            x;
          //console.log(url);
          return url;
        },
        projection: "EPSG:4490",
      }),
    });
    var vectorSource = new ol.source.Vector({
      format: new ol.format.GeoJSON(),
      url: function (extent) {
        return "http://1.1.1.1:8080/68DE38F71E38CD8C508FAB3035752EA8ED8F9221EDE18FDBE593B01FCDD12BD296F09FE27CD7D2733AD075EAF994851B/PBS/rest/services/lsyt_dmdz_qxbj0619/MapServer/wfs?service=wfs&version=1.0.0&request=getfeature&typename=lsyt_dmdz_qxbj0619&outputFormat=application/json";
      },
      //strategy: bboxStrategy,
    });
    var vector = new ol.layer.Vector({
      source: vectorSource,
      style: new ol.style.Style({
        stroke: new ol.style.Stroke({
          color: "rgba(0, 0, 255, 1.0)",
          width: 2,
        }),
      }),
    });
    var map = new ol.Map({
      target: "map",
      layers: [tileLayer, vector],
      view: new ol.View({
        projection: projection,
      }),
    });
    map.getView().fit(bounds, map.getSize()); //非常重要
  \</script>
\</body>
\</html>
查询
点查询
\<!DOCTYPE html>
\<html>
\<head>
  \<meta charset="UTF-8" />
  \<title>点查询\</title>
  \<link rel="stylesheet" href="http://1.1.1.1:8082/openlayer/v3.20.1/css/ol.css" type="text/css" />
  \<script src="http://1.1.1.1:8082/openlayer/v3.20.1/build/ol.js">\</script>
  \<script src="http://1.1.1.1:8082/jquery/jquery.js">\</script>
\</head>
\<body>
  \<div id="map" class="map">\</div>
  \<script>
    var format = "image/png";
    var bounds = [
      119.347618103027,
      29.7052669525146,
      120.698570251465,
      30.5366992950439,
    ];
    var projection = new ol.proj.Projection({
      code: "EPSG:4490",
      units: "degrees",
      axisOrientation: "neu",
      global: true,
    });
    var fullExtent = [
      118.33968849655,
      29.188589472,
      120.71408849655,
      30.5651894750343,
    ];
    var resolutions = [
      0.00549933137239034,
      0.00274966568619517,
      0.00137483284309758,
      0.000687416421548792,
      0.000343708210774396,
      0.000171854105387198,
      8.5927052693599e-5,
      4.29635263467995e-5,
      2.14817631733998e-5,
      1.07408815866999e-5,
      5.37044079334994e-6,
      2.68522039667497e-6,
      1.34261019833748e-6,
    ];
    var tileGrid = new ol.tilegrid.TileGrid({
      tileSize: 256,
      origin: [118.122911693886, 31.2869311022836],
      extent: fullExtent,
      resolutions: resolutions,
    });
    // ol.source.XYZ添加瓦片地图的层
    var tileLayer = new ol.layer.Tile({
      source: new ol.source.XYZ({
        tileGrid: tileGrid,
        tileUrlFunction: function (tileCoord) {
          var z = tileCoord[0];
          var x = tileCoord[1];
          var y = -tileCoord[2] - 1;
          var url =
            "http://1.1.1.1:8080/68DE38F71E38CD8C508FAB3035752EA8ED8F9221EDE18FDBE593B01FCDD12BD296F09FE27CD7D2733AD075EAF994851B/PBS/rest/services/hzsyvector/Mapserver/tile/" +
            z +
            "/" +
            y +
            "/" +
            x;
          //console.log(url);
          return url;
        },
        projection: "EPSG:4490",
      }),
    });
    var vectorSource = new ol.source.Vector({
      format: new ol.format.GeoJSON(),
      url: function (extent) {
        return "http://1.1.1.1:8080/68DE38F71E38CD8C508FAB3035752EA8ED8F9221EDE18FDBE593B01FCDD12BD296F09FE27CD7D2733AD075EAF994851B/PBS/rest/services/lsyt_dmdz_qxbj0619/MapServer/wfs?service=wfs&version=1.0.0&request=getfeature&typename=lsyt_dmdz_qxbj0619&outputFormat=application/json";
      },
      //strategy: bboxStrategy,
    });
    var vector = new ol.layer.Vector({
      source: vectorSource,
      style: new ol.style.Style({
        stroke: new ol.style.Stroke({
          color: "rgba(0, 0, 255, 1.0)",
          width: 2,
        }),
      }),
    });
    var map = new ol.Map({
      target: "map",
      layers: [tileLayer, vector],
      view: new ol.View({
        projection: projection,
      }),
    });
    map.getView().fit(bounds, map.getSize()); //非常重要
    map.on("click", function (e) {
      var location = e.coordinate;
      var point = location[0] + "," + location[1] + "," + location[0] + "," + location[1];// "120.16271670916996,30.251675868508478,120.1713094144393,30.25591314629446";
      var qurl =
        "http://1.1.1.1:8080/68DE38F71E38CD8C508FAB3035752EA8ED8F9221EDE18FDBE593B01FCDD12BD296F09FE27CD7D2733AD075EAF994851B/PBS/rest/services/lsyt_dmdz_qxbj0619/MapServer/wfs?service=wfs&version=1.0.0&request=getfeature&typename=lsyt_dmdz_qxbj0619&outputFormat=application/json&CQL_FILTER=BBOX(geom," + point + ")";
      $.ajax({
        url: qurl,
        success: function (data) {
          console.log(data);
          var text = JSON.parse(data);
          alert("You clicked the map at " + text.features[1].properties['quxian']);
        }
      });
    });
  \</script>
\</body>
\</html>
面查询
\<!DOCTYPE html>
\<html>
\<head>
  \<meta charset="UTF-8" />
  \<title>框选查询\</title>
  \<link rel="stylesheet" href="http://1.1.1.1:8082/openlayer/v3.20.1/css/ol.css" type="text/css" />
  \<script src="http://1.1.1.1:8082/openlayer/v3.20.1/build/ol.js">\</script>
  \<script src="http://1.1.1.1:8082/jquery/jquery.js">\</script>
\</head>
\<body>
  \<div id="map" class="map">\</div>
  \<script>
    var format = "image/png";
    var bounds = [
      119.347618103027,
      29.7052669525146,
      120.698570251465,
      30.5366992950439,
    ];
    var projection = new ol.proj.Projection({
      code: "EPSG:4490",
      units: "degrees",
      axisOrientation: "neu",
      global: true,
    });
    var fullExtent = [
      118.33968849655,
      29.188589472,
      120.71408849655,
      30.5651894750343,
    ];
    var resolutions = [
      0.00549933137239034,
      0.00274966568619517,
      0.00137483284309758,
      0.000687416421548792,
      0.000343708210774396,
      0.000171854105387198,
      8.5927052693599e-5,
      4.29635263467995e-5,
      2.14817631733998e-5,
      1.07408815866999e-5,
      5.37044079334994e-6,
      2.68522039667497e-6,
      1.34261019833748e-6,
    ];
    var tileGrid = new ol.tilegrid.TileGrid({
      tileSize: 256,
      origin: [118.122911693886, 31.2869311022836],
      extent: fullExtent,
      resolutions: resolutions,
    });
    // ol.source.XYZ添加瓦片地图的层
    var tileLayer = new ol.layer.Tile({
      source: new ol.source.XYZ({
        tileGrid: tileGrid,
        tileUrlFunction: function (tileCoord) {
          var z = tileCoord[0];
          var x = tileCoord[1];
          var y = -tileCoord[2] - 1;
          var url =
            "http://1.1.1.1:8080/68DE38F71E38CD8C508FAB3035752EA8ED8F9221EDE18FDBE593B01FCDD12BD296F09FE27CD7D2733AD075EAF994851B/PBS/rest/services/hzsyvector/Mapserver/tile/" +
            z +
            "/" +
            y +
            "/" +
            x;
          //console.log(url);
          return url;
        },
        projection: "EPSG:4490",
      }),
    });
    var vectorSource = new ol.source.Vector({
      format: new ol.format.GeoJSON(),
      url: function (extent) {
        return "http://1.1.1.1:8080/68DE38F71E38CD8C508FAB3035752EA8ED8F9221EDE18FDBE593B01FCDD12BD296F09FE27CD7D2733AD075EAF994851B/PBS/rest/services/lsyt_dmdz_qxbj0619/MapServer/wfs?service=wfs&version=1.0.0&request=getfeature&typename=lsyt_dmdz_qxbj0619&outputFormat=application/json";
      },
      //strategy: bboxStrategy,
    });
    var vector = new ol.layer.Vector({
      source: vectorSource,
      style: new ol.style.Style({
        stroke: new ol.style.Stroke({
          color: "rgba(0, 0, 255, 1.0)",
          width: 2,
        }),
      }),
    });
    var map = new ol.Map({
      target: "map",
      layers: [tileLayer, vector],
      view: new ol.View({
        projection: projection,
      }),
    });
    map.getView().fit(bounds, map.getSize()); //非常重要
    var dragbox = new ol.interaction.DragBox();
    map.addInteraction(dragbox);
    dragbox.on("boxend", function () {
      var extent = dragbox.getGeometry().getExtent();
      var point = extent[0] + "," + extent[1] + "," + extent[0] + "," + extent[1];// "120.16271670916996,30.251675868508478,120.1713094144393,30.25591314629446";
      var qurl =
        "http://1.1.1.1:8080/68DE38F71E38CD8C508FAB3035752EA8ED8F9221EDE18FDBE593B01FCDD12BD296F09FE27CD7D2733AD075EAF994851B/PBS/rest/services/lsyt_dmdz_qxbj0619/MapServer/wfs?service=wfs&version=1.0.0&request=getfeature&typename=lsyt_dmdz_qxbj0619&outputFormat=application/json&CQL_FILTER=BBOX(geom," + point + ")";
      $.ajax({
        url: qurl,
        success: function (data) {
          console.log(data);
          var text = JSON.parse(data);
          alert("You clicked the map at " + text.features[0].properties['quxian']);
        }
      });
    })
  \</script>
\</body>
\</html>
属性查询
\<!DOCTYPE html>
\<html>
\<head>
  \<meta charset="UTF-8" />
  \<title>属性查询\</title>
  \<link rel="stylesheet" href="http://1.1.1.1:8082/openlayer/v3.20.1/css/ol.css" type="text/css" />
  \<script src="http://1.1.1.1:8082/openlayer/v3.20.1/build/ol.js">\</script>
  \<script src="http://1.1.1.1:8082/jquery/jquery.js">\</script>
\</head>
\<body>
  \<div id="map" class="map">\</div>
  \<script>
    var format = "image/png";
    var bounds = [
      119.347618103027,
      29.7052669525146,
      120.698570251465,
      30.5366992950439,
    ];
    var projection = new ol.proj.Projection({
      code: "EPSG:4490",
      units: "degrees",
      axisOrientation: "neu",
      global: true,
    });
    var fullExtent = [
      118.33968849655,
      29.188589472,
      120.71408849655,
      30.5651894750343,
    ];
    var resolutions = [
      0.00549933137239034,
      0.00274966568619517,
      0.00137483284309758,
      0.000687416421548792,
      0.000343708210774396,
      0.000171854105387198,
      8.5927052693599e-5,
      4.29635263467995e-5,
      2.14817631733998e-5,
      1.07408815866999e-5,
      5.37044079334994e-6,
      2.68522039667497e-6,
      1.34261019833748e-6,
    ];
    var tileGrid = new ol.tilegrid.TileGrid({
      tileSize: 256,
      origin: [118.122911693886, 31.2869311022836],
      extent: fullExtent,
      resolutions: resolutions,
    });
    // ol.source.XYZ添加瓦片地图的层
    var tileLayer = new ol.layer.Tile({
      source: new ol.source.XYZ({
        tileGrid: tileGrid,
        tileUrlFunction: function (tileCoord) {
          var z = tileCoord[0];
          var x = tileCoord[1];
          var y = -tileCoord[2] - 1;
          var url =
            "http://1.1.1.1:8080/68DE38F71E38CD8C508FAB3035752EA8ED8F9221EDE18FDBE593B01FCDD12BD296F09FE27CD7D2733AD075EAF994851B/PBS/rest/services/hzsyvector/Mapserver/tile/" +
            z +
            "/" +
            y +
            "/" +
            x;
          //console.log(url);
          return url;
        },
        projection: "EPSG:4490",
      }),
    });
    var vectorSource = new ol.source.Vector({
      format: new ol.format.GeoJSON(),
      url: function (extent) {
        return "http://1.1.1.1:8080/68DE38F71E38CD8C508FAB3035752EA8ED8F9221EDE18FDBE593B01FCDD12BD296F09FE27CD7D2733AD075EAF994851B/PBS/rest/services/lsyt_dmdz_qxbj0619/MapServer/wfs?service=wfs&version=1.0.0&request=getfeature&typename=lsyt_dmdz_qxbj0619&outputFormat=application/json";
      },
      //strategy: bboxStrategy,
    });
    var vector = new ol.layer.Vector({
      source: vectorSource,
      style: new ol.style.Style({
        stroke: new ol.style.Stroke({
          color: "rgba(0, 0, 255, 1.0)",
          width: 2,
        }),
      }),
    });
    var map = new ol.Map({
      target: "map",
      layers: [tileLayer, vector],
      view: new ol.View({
        projection: projection,
      }),
    });
    map.getView().fit(bounds, map.getSize()); //非常重要
    map.on("click", function (e) {
      var location = e.coordinate;
      var point = location[0] + "," + location[1] + "," + location[0] + "," + location[1];// "120.16271670916996,30.251675868508478,120.1713094144393,30.25591314629446";
      var qurl =
        "http://1.1.1.1:8080/68DE38F71E38CD8C508FAB3035752EA8ED8F9221EDE18FDBE593B01FCDD12BD296F09FE27CD7D2733AD075EAF994851B/PBS/rest/services/lsyt_dmdz_qxbj0619/MapServer/wfs?service=wfs&version=1.0.0&request=getfeature&typename=lsyt_dmdz_qxbj0619&outputFormat=application/json&CQL_FILTER=";
      qurl += " quxian='上城区'";
      $.ajax({
        url: qurl,
        success: function (data) {
          console.log(data);
          var text = JSON.parse(data);
          alert("根据属性选择的是" + text.features[0].properties['quxian']);
        }
      });
    });
  \</script>
\</body>
\</html>
组合查询
\<!DOCTYPE html>
\<html>
\<head>
  \<meta charset="UTF-8" />
  \<title>组合查询\</title>
  \<link rel="stylesheet" href="http://1.1.1.1:8082/openlayer/v3.20.1/css/ol.css" type="text/css" />
  \<script src="http://1.1.1.1:8082/openlayer/v3.20.1/build/ol.js">\</script>
  \<script src="http://1.1.1.1:8082/jquery/jquery.js">\</script>
\</head>
\<body>
  \<div id="map" class="map">\</div>
  \<script>
    var format = "image/png";
    var bounds = [
      119.347618103027,
      29.7052669525146,
      120.698570251465,
      30.5366992950439,
    ];
    var projection = new ol.proj.Projection({
      code: "EPSG:4490",
      units: "degrees",
      axisOrientation: "neu",
      global: true,
    });
    var fullExtent = [
      118.33968849655,
      29.188589472,
      120.71408849655,
      30.5651894750343,
    ];
    var resolutions = [
      0.00549933137239034,
      0.00274966568619517,
      0.00137483284309758,
      0.000687416421548792,
      0.000343708210774396,
      0.000171854105387198,
      8.5927052693599e-5,
      4.29635263467995e-5,
      2.14817631733998e-5,
      1.07408815866999e-5,
      5.37044079334994e-6,
      2.68522039667497e-6,
      1.34261019833748e-6,
    ];
    var tileGrid = new ol.tilegrid.TileGrid({
      tileSize: 256,
      origin: [118.122911693886, 31.2869311022836],
      extent: fullExtent,
      resolutions: resolutions,
    });
    // ol.source.XYZ添加瓦片地图的层
    var tileLayer = new ol.layer.Tile({
      source: new ol.source.XYZ({
        tileGrid: tileGrid,
        tileUrlFunction: function (tileCoord) {
          var z = tileCoord[0];
          var x = tileCoord[1];
          var y = -tileCoord[2] - 1;
          var url =
            "http://1.1.1.1:8080/68DE38F71E38CD8C508FAB3035752EA8ED8F9221EDE18FDBE593B01FCDD12BD296F09FE27CD7D2733AD075EAF994851B/PBS/rest/services/hzsyvector/Mapserver/tile/" +
            z +
            "/" +
            y +
            "/" +
            x;
          //console.log(url);
          return url;
        },
        projection: "EPSG:4490",
      }),
    });
    var vectorSource = new ol.source.Vector({
      format: new ol.format.GeoJSON(),
      url: function (extent) {
        return "http://1.1.1.1:8080/68DE38F71E38CD8C508FAB3035752EA8ED8F9221EDE18FDBE593B01FCDD12BD296F09FE27CD7D2733AD075EAF994851B/PBS/rest/services/lsyt_dmdz_qxbj0619/MapServer/wfs?service=wfs&version=1.0.0&request=getfeature&typename=lsyt_dmdz_qxbj0619&outputFormat=application/json";
      },
      //strategy: bboxStrategy,
    });
    var vector = new ol.layer.Vector({
      source: vectorSource,
      style: new ol.style.Style({
        stroke: new ol.style.Stroke({
          color: "rgba(0, 0, 255, 1.0)",
          width: 2,
        }),
      }),
    });
    var map = new ol.Map({
      target: "map",
      layers: [tileLayer, vector],
      view: new ol.View({
        projection: projection,
      }),
    });
    map.getView().fit(bounds, map.getSize()); //非常重要
    map.on("click", function (e) {
      var location = e.coordinate;
      var point = location[0] + "," + location[1] + "," + location[0] + "," + location[1];// "120.16271670916996,30.251675868508478,120.1713094144393,30.25591314629446";
      var qurl =
        "http://1.1.1.1:8080/68DE38F71E38CD8C508FAB3035752EA8ED8F9221EDE18FDBE593B01FCDD12BD296F09FE27CD7D2733AD075EAF994851B/PBS/rest/services/lsyt_dmdz_qxbj0619/MapServer/wfs?service=wfs&version=1.0.0&request=getfeature&typename=lsyt_dmdz_qxbj0619&outputFormat=application/json&CQL_FILTER=BBOX(geom," + point + ")";
      qurl += " and quxian='上城区'";
      $.ajax({
        url: qurl,
        success: function (data) {
          console.log(data);
          var text = JSON.parse(data);
          if (!text.features.length) {
            alert("你选择的是非上城区,无查询结果!");
          } else {
            alert("你选择的是 " + text.features[0].properties["quxian"]);
          }
        }
      });
    });
  \</script>
\</body>
\</html>
Cygwin
windows使用linux环境(部分机型失败)
Tippecanoe
Tippecanoe是Mapbox的一个开源切片工具,项目地址:https://github.com/mapbox/tippecanoe,Mapbox常规的切片方法tilelive-copy参见另一篇博客。Tippecanoe主要在处理大数据量时有很大的优势,具有很高的效率,并且有很多参数可以控制。Tippecanoe只能处理GeoJSON,因此在切片前需要将矢量数据转换为GeoJSON,推荐使用ogr2ogr工具转换。切片以后的格式为mbtiles,可自行导入mongodb等数据库。
目的:根据你的数据创造一个可自由缩放的视图
引用地址:https://my.oschina.net/u/1464512/blog/1631972
常用tippecanoe参数设置
GEOJSON
GeoSever
GeoServer是OGC Web服务器规范的J2EE实现,利用GeoServer可以方便地发布地图数据,允许用户对特征数据进行更新、删除、插入操作,通过GeoServer可以比较容易地在用户之间迅速共享空间地理信息。GeoServer是开源软件。
GeoServer主要包含如下一些特点:
兼容WMS和WFS特性
支持PostGIS、Shapefile、ArcSDE、Oracle、VPF、MySQL、MapInfo
支持上百种投影
能够将网络地图输出为JPEG、GIF、PNG、SVG、KML等格式
能够运行在任何基于J2EE/Servlet容器之上
嵌入MapBuilder支持AJAX的地图客户端OpenLayers
WMS && WFS
WMS是由服务器将一地图图像发送给客户端,而WFS是服务器将矢量数据发送给客户端,也就是在使用WMS时地图由服务器绘制,在使用WFS时地图由客户端绘制。
WMS
1.2.1 WMS服务简介
Web Map Service(网络地图服务),简称WMS,由开放地理信息联盟(Open GeoSpatial Consortium,OGC)制定。该规范定义了Web客户端从网络地图服务器获取地图的接口标准。一个WMS可以动态地生成具有地理参考数据的地图,这些地图通常用GIF、JPEG或PNG等图像格式等,使用者通过指定的参数获取相应的地图图片。
1.2.2 服务操作列表
WMS实现规范由三个基础性操作协议(GetCapabilities,GetMap和GetFeatureInfo)组成,这些协议共同构成了利用WMS创建和叠加显示不同来源的远程异构地图服务的基础。WMS服务操作列表见下表所示。
| 操作 | 实现要求 | 描述 |
|---|---|---|
| GetCapabilities | 强制实现 | 暂关闭 |
| GetMap | 强制实现 | 获取地图图片。该操作根据客户端发出的请求参数在服务端进行检索,服务器端返回一个地图图像,其地理空间参数和大小参数是已经明确定义的,返回的地图图像可以是GIF、JPEG、PNG或SVG格式。 |
| GetFeatureInfo | 选择实现 |
1.2.3服务操作的参数列表
| 参数名称 | 参数个数 | 参数类型和值 |
|---|---|---|
| service | 1个(必选) | 字符类型,服务类型值为“WMS” |
| request | 1个(必选) | 字符类型,请求的操作名称,值为“GetCapabilities” |
| version | 0或1个(可选) | 字符类型,值为请求的WMS的版本号 |
| format | 0或1个(可选) | MIME类型,值为服务元数据的输出格式 |
GetMap操作请求方法实现参数
| 参数名称 | 参数个数 | 参数类型和值 |
|---|---|---|
| service | 1个(必选) | 字符类型,服务类型标识值为“WMS” |
| request | 1个(必选) | 字符类型,值为“GetMap” |
| version | 1个(必选) | 字符类型,值为请求的WMS的版本号 |
| layers | 1个(必选) | 字符类型,值为一个或多个地图图层列表,多个图层之间用”,”隔开 |
| styles | 1个(必选) | 字符类型,值为请求图层的地图渲染样式 |
| CRS | 1个(必选) | 字符类型,值为坐标参照系统 |
| BBOX | 1个(必选) | Wkt格式,值为某个CRS下的地图边界范围的坐标序列 |
| width | 1个(必选) | 整型类型,值为地图图片的像素宽度 |
| height | 1个(必选) | 整型类型,值为地图图片的像素高度 |
| format | 1个(必选) | 字符类型,值为地图的输出格式 |
| transparent | 0或1个(可选) | 字符类型,值为true或者false,用来表示地图图层是否透明(默认情况下是不透明的) |
| filter | 0或1个(可选) | 请求要素的过滤条件 |
1.2.4 接口调用示例
WFS
1.3.1 WFS服务简介
Web Feature Service(网络要素服务),简称WFS,由开放地理信息联盟(Open GeoSpatial Consortium,OGC)制定。该规范主要对OpenGIS简单要素的数据编辑操作进行规范,从而使服务器端和客户端能够在要素层面进行“通讯”。其返回结果的是XML格式的WFS服务元数据文档,通过该文档用户能够了解:WFS服务器支持的所有操作操作列表,GetFeature操作返回的数据格式,可用的坐标参照系统列表,操作异常信息的列表,WFS服务提供商的相关信息,WFS服务器的可用要素类列表等。
1.3.2 服务操作列表
WFS服务接口规范定义了GetCapabilities,DescribeFeatureType、GetFeature、Transaction等操作。其中GetCapabilities,DescribeFeatureType和GetFeature为必须实现的操作,也即只要实现了这三个操作的服务均可称为WFS服务。WFS的操作见下表所示。
| 操作 | 实现要求 | 描述 |
|---|---|---|
| GetCapabilities | 强制实现 | GetCapabilities请求用于查询WFS服务的能力信息,包括支持的操作、支持的格式、空间坐标、包含的资源等。它主要的目的是使客户端在使用GetFeature请求前可以对WFS服务有一个基本的了解,从而可以设置正确的参数。 |
| DescribeFeatureType | 强制实现 | 用于生成一个 Schema 描述,该 Schema 描述了 WFS 服务提供的要素类型(Feature Type),以及要素类型的结构信息。该 Schema 还定义了 WFS 服务所期望的要素实例在输入时如何编码以及输出时如何生成要素实例。 |
| GetFeature | 强制实现 | GetFeature用于向WFS的客户端程序提供查询特定地理信息的能力,通过GetFeature操作可以由指定的属性条件、空间条件或者两者叠加的条件进行空间查询。 |
| Transaction | 选择实现 | 允许Transaction操作,使客户端可对服务器端所提供的地图要素类执插入,更新,删除等命令 |
1.3.3服务操作的参数列表
GetCapabilities操作请求方法实现参数
| 参数名称 | 参数个数 | 参数类型和值 |
|---|---|---|
| service | 1个(必选) | 字符类型,服务类型值为“WFS” |
| request | 1个(必选) | 字符类型,请求的操作名称,值为“GetCapabilities” |
| versions | 0或1个(可选) | 字符类型,值为请求的WFS的版本号 |
DescribeFeatureType操作请求方法实现参数
| 参数名称 | 参数个数 | 参数类型和值 |
|---|---|---|
| service | 1个(必选) | 字符类型,服务类型值为“WFS” |
| request | 1个(必选) | 字符类型,请求的操作名称,值为“DescribeFeatureType” |
| typeName | 0或1个(可选) | 字符类型,值为要素类型的列表,多个值之间用“,”隔开,默认解析包括的全部要素类型 |
| outputFormat | 0或1个(可选) | MIME类型,值为输出格式 |
GetFeature操作请求方法实现参数
| 参数名称 | 参数个数 | 参数类型和值 |
|---|---|---|
| service | 1个(必选) | 字符类型,服务类型标识值为“WFS” |
| request | 1个(必选) | 字符类型,请求的操作值为“GetFeature” |
| typeName | 1个(必选) | 字符类型,值为请求的要素类型的名称,多个名称之间用“,”隔开 |
| version | 0或1个(可选) | 字符类型,值为请求的WFS的版本号 |
| outputFormat | 0或1个(可选) | MIME类型,值为输出格式 |
| resultType | 0或1个(可选) | 字符类型,值为请求的结果类型 |
| propertyName | 0或1个(可选) | 字符类型,值为请求要素的属性名,多个值之间用“,”隔开 |
| featureVersion | 0或1个(可选) | 字符类型,值为要素的版本,值为ALL返回请求的要素的所有版本,没有值默认为返回请求要素的最新版本 |
| maxFeature | 0或1个(可选) | 整型类型,值为请求要素的最大数,默认值为满足查询的所有结果集 |
| expiry | 0或1个(可选) | 数字类型,要素被锁定的时间 |
| SRSName | 0或1个(可选) | 字符类型,值为坐标系统名 |
| featureID | 0或1个(可选) | 字符类型,值为要素的ID,多个ID之间用“,”隔开 |
| filter | 0或1个(可选) | 请求要素的过滤条件 |
| bBox | 0或1个(可选) | Wkt格式,请求指定要素查询范围,可以替代featureId和filter参数 |
1.3.4 接口调用示例
WMTS
WMTS
1.1 WMTS服务简介
Web Map Tile Service(网络地图瓦片服务),简称WMTS,由开放地理信息联盟(Open GeoSpatial Consortium,OGC)制定,是和WMS并列的重要OGC规范之一。WMTS标准定义了一些操作,这些操作允许用户访问切片地图,是OGC首个支持RESTful访问的服务标准。WMTS不同于WMS,它最重要的特征是采用缓存技术能够缓解WebGIS服务器端数据处理的压力,提高交互响应速度,大幅改善在线地图应用客户端的用户体验。WMTS是OGC主推的缓存技术规范,是目前各种缓存技术相互兼容的一种方法。
WMTS的切片坐标系统和其组织方式可参考下图:
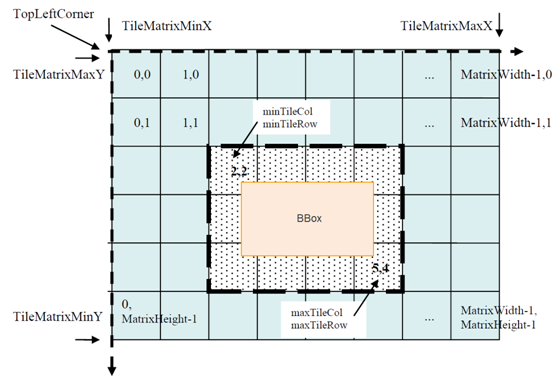
1.2 服务操作列表
WMTS服务支持RESTful访问,其接口包括GetCapabilities、GetTile和GetFeatureInfo3个操作,这些操作允许用户访问切片地图。
| 操作 | 操作 | 描述 |
|---|---|---|
| GetCapabilities | 强制实现 | 获取WMTS的能力文档(即元数据文档),里面包含服务的信息 |
| GetTile | 强制实现 | 该操作根据客户端发出的请求参数在服务端进行检索,服务器端返回地图瓦片图像 |
| GetFeatureInfo | 选择实现 |
1.3 服务操作的参数列表
GetCapabilities操作请求方法实现参数
| 参数名称 | 参数个数 | 参数类型和值 |
|---|---|---|
| service | 1个(必选) | 字符类型,服务类型值为“WMTS” |
| request | 1个(必选) | 字符类型,请求的操作名称,值为“GetCapabilities” |
GetTile操作请求方法实现参数
| 参数名称 | 参数个数 | 参数类型和值 |
|---|---|---|
| service | 1个(必选) | 字符类型,服务类型标识值为“WMTS” |
| request | 1个(必选) | 字符类型,请求的操作值为“GetTile” |
| version | 1个(必选) | 字符类型,值为请求的WMTS的版本号 |
| layer | 1个(必选) | 字符类型,值为请求的图层名称 |
| style | 1个(必选) | 字符类型,值为请求图层的渲染样式 |
| format | 1个(必选) | 字符类型,值为瓦片地图的输出格式 |
| tileMatrixSet | 1个(必选) | 字符类型,瓦片矩阵数据集,其值在服务的元数据文档中指定 |
| tileMatrix | 1个(必选) | 字符类型,瓦片矩阵,其值在服务的元数据文档中指定 |
| tileRow | 1个(必选) | 整型类型,值为大于0的整数,表示瓦片矩阵的行号 |
| tileCol | 1个(必选) | 整型类型,值为大于0的整数,表示瓦片矩阵的列号 |